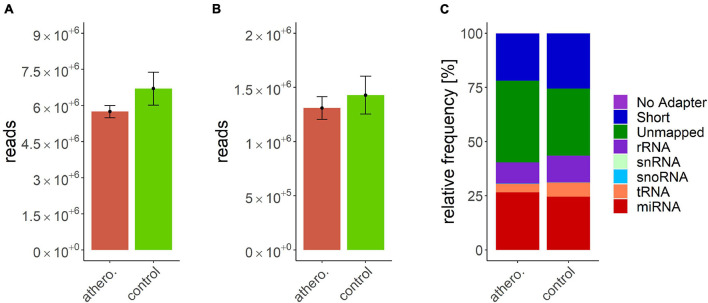
FIGURE 1.
(A) mean library size: athero: 5.74 ± 0.25 M.; control: 6.7 ± 0.69 M.; (B) mean of mapped miRNAs: athero: 1.31 ± 0.11 M.; controlr: 1.43 ± 0.17 M.; (C) mean relative frequency of mapped read counts. athero = atherosclerotic group; control = control group; No Adapter = reads without adapter; Short = reads smaller than 16 nt; Unmapped = reads which are not mapped to reference; rRNA = reads mapped as rRNA; snRNA = reads mapped as snRNA; snoRNA = reads mapped as snoRNA; tRNA = reads mapped as tRNA; miRNA = reads mapped as miRNA.

