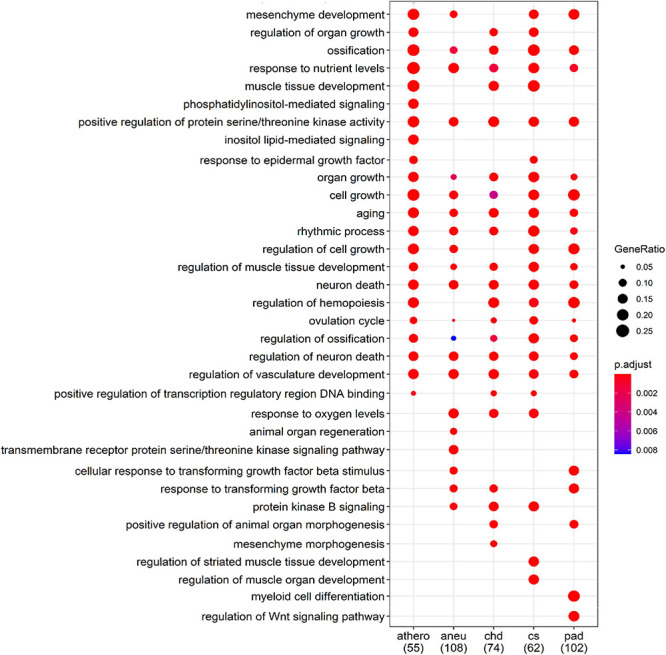
FIGURE 7.

Comparison of the first 34 most enriched GO terms across groups. Gene Ratio indicates the percentage of GO term annotated genes in the gene set. The numbers in brackets indicate the size of the gene set per group; athero = atherosclerosis; aneu = abdominal aneurysm; chd = coronary heart disease; cs = carotid stenosis; pad = peripheral artery disease.
