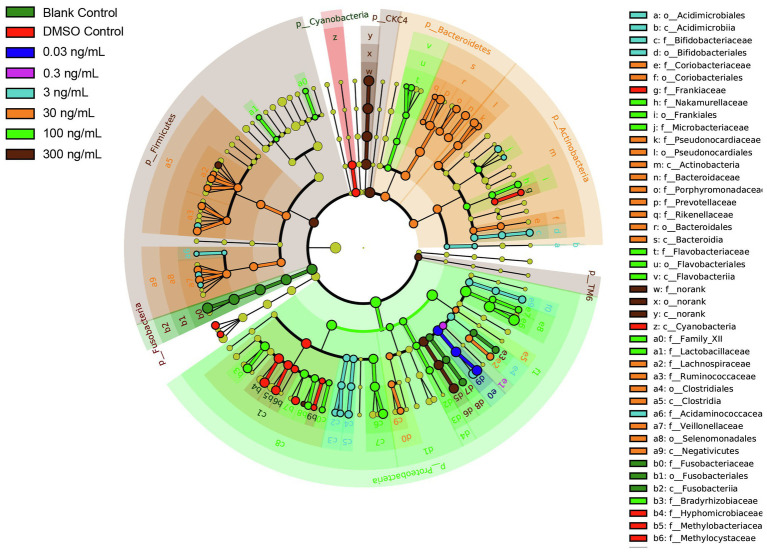
Figure 5.
LDA Effect Size (LEfSe) cladograms of pairwise analysis for long-term TCS exposure with 16S rDNA sequence analysis in microbiota within the gastrointestinal tract of zebrafish. The cladogram shows the taxonomic levels represented by rings with phyla at the innermost ring and genera at the outermost ring, and each circle is a member within that level. Different taxa at class, order, and family levels are listed on the right side of the cladogram.

