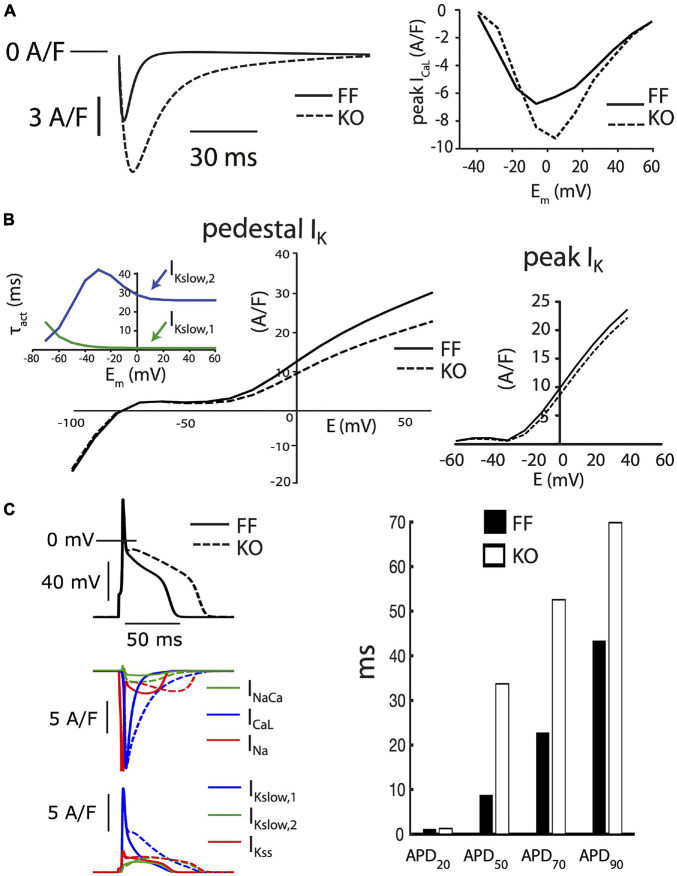
FIGURE 5.
Baseline FF and KO computational models. (A) ICaL in the KO model was parameterized to permit the markedly slowed ICaL inactivation accompanying loss of SR calcium release (left panel) and moderately increased peak current observed in KO myocytes (right panel). (B) Conductances for the slower activating component of IKslow (Kv2.1, IKslow,2) and the steady state K+ current (IKss) were both reduced by 25% to fit end-pulse “pedestal” total IK (main left panel). Simulated currents were assessed as the sum of all end-pulse K+ currents as for the experimental measurements shown in Figure 2, where this compound current is referred to as IKp. To simultaneously fit the pedestal and peak components of the compound IK, as well as differences in ICaL and steady state APD, it was necessary to implement the slower activation kinetics of Kv2.1/IKslow,2 (inset left). Peak IK was straightforwardly fit through scaling the conductance of Ito,f in both the FF and KO models (right panel). (C) Together, these alterations resulted in slowed intermediate repolarization (APD50 and APD70) similar to that observed for KO myocytes. However, the slower early repolarization and rapid late repolarization in KO cells were much more difficult to capture with models that remained faithful to the voltage-clamp measurements. See Supplementary Table 1 for complete details of differences between these two baseline models.

