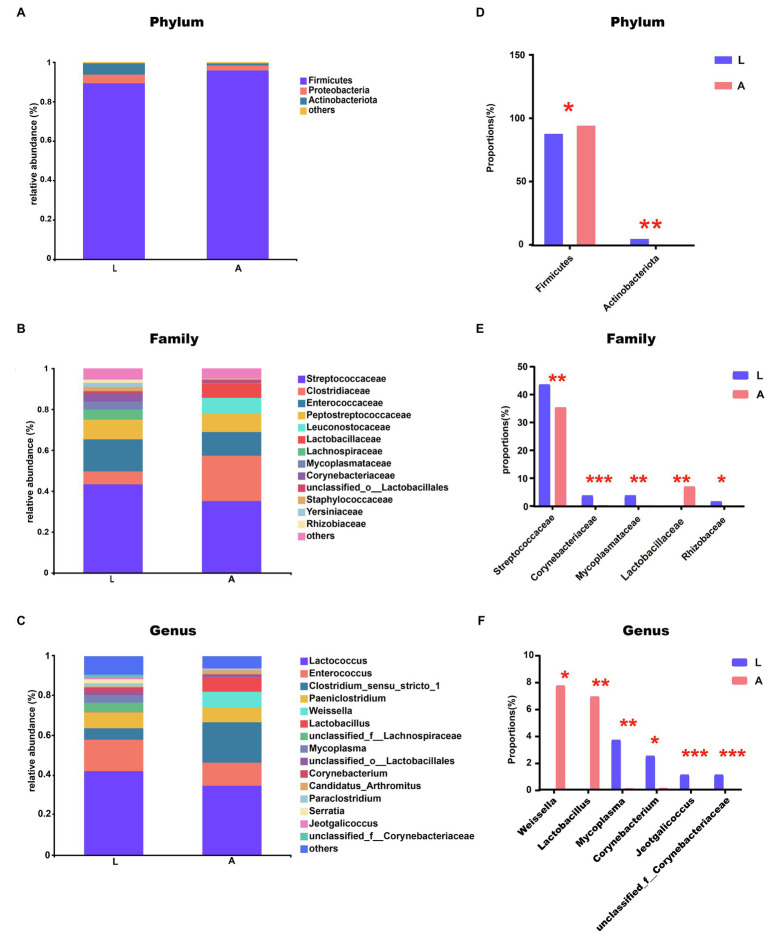
Figure 4.
(A–C) Relative abundance of major taxa in microbiotas of the bat gut: (A) Phylum level, (B) Family level, and (C) Genus level. (D–F) Analysis of gut microbial community differences: (D) Analysis of phylum-level differences, (E) Analysis of family-level differences, and (F) Analysis of genus-level differences (*0.01<p≤0.05, **0.001<p≤0.01, and ***p≤0.001).

