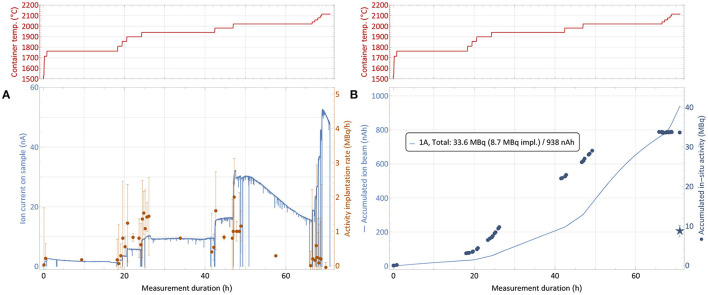
Figure 6.
167Tm collection process for sample 1 (82.5 MBq 167Tm, see Table 1). The top panels show the sample container temperature over time. The bottom left graph (A) depicts the ion current measured on the implantation foil and the rate of 167Tm activity implantation. The bottom right graph (B) depicts the respective accumulated values. Due to sputtering effects of the high intensity ion beam, only a fraction of the activity measured to be present in the collection chamber remained on the foils, as shown by the star marker that depicts the gamma-ray spectroscopy measurements of the foils after collection. Errors on the activity are 95% confidence intervals of constant 0.2 MBq for the activity which are propagated into the rates. The inset in (B) describes the measured total in-situ activity in comparison to the gamma-ray spectrometry of the foil afterwards and the integrated intake of ion beam.

