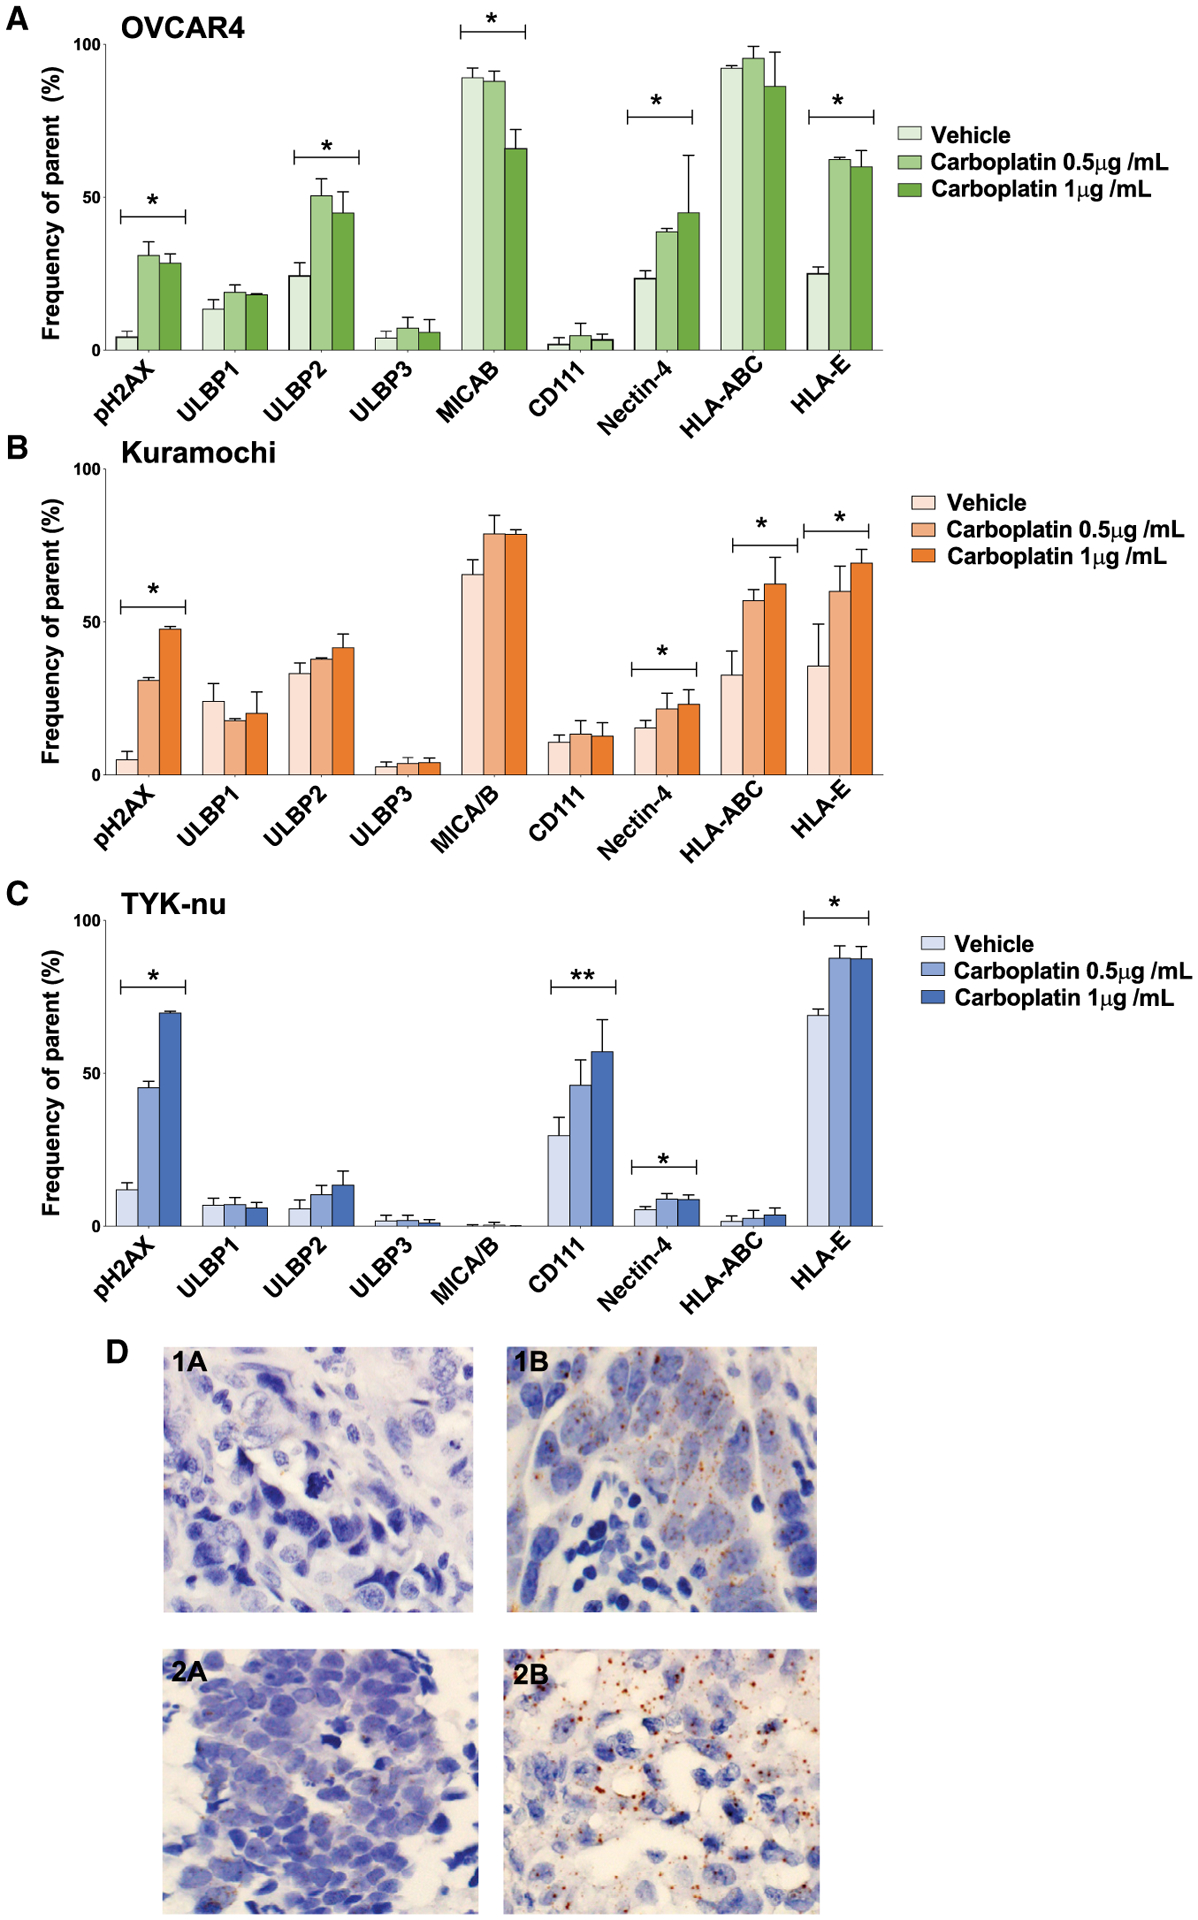
Figure 4. Responses to carboplatin across E, EV, and V HGSC cell lines.

Cell lines were exposed to carboplatin or vehicle (H2O) as indicated. Frequencies of HGSC cells (y axis) expressing NK receptor ligands and pH2AX (x axis).
(A–C) OVCAR4 (A), Kuramochi (B), and TYK-nu cell lines (C). Triplicates with standard deviations. *p ≤ 0.05, **p ≤ 0.005 for overall ANOVA.
(D) Nectin-4 mRNA expression in tumor tissue after NACT (brown staining 1B and 2B). Absent before NACT in matched samples (1A and 2A).
