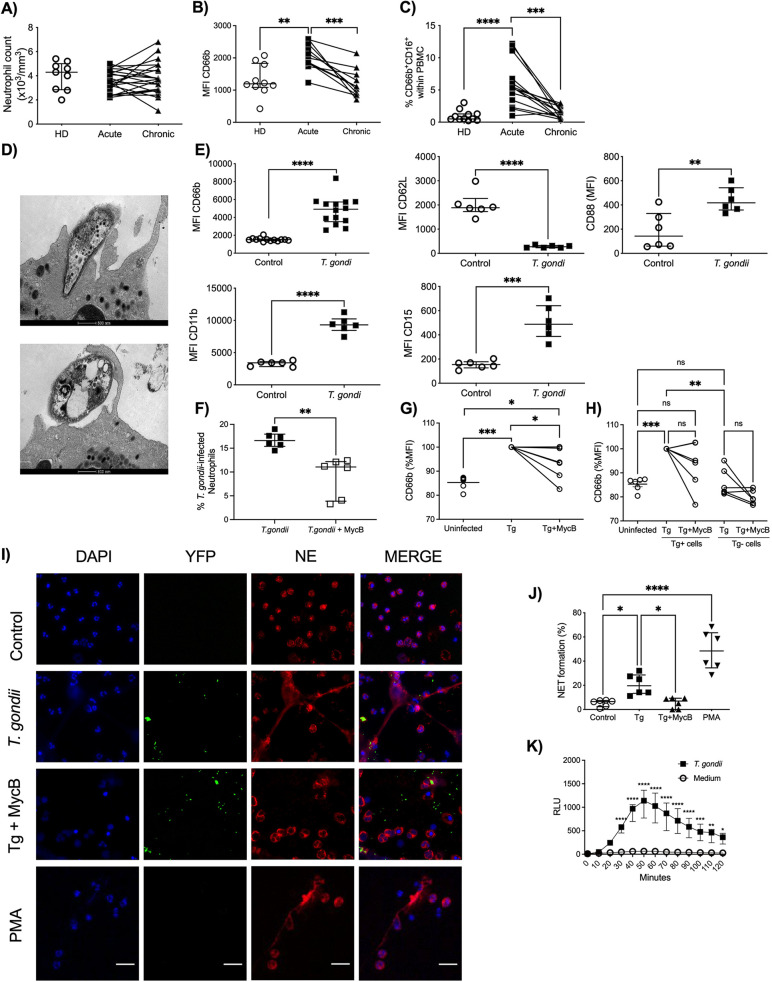
FIG 1.
T. gondii induces neutrophil activation and NET formation. (A to C) Neutrophil absolute counts in whole blood (A), scatter dot plots of the activation marker CD66b (B), and frequency of CD66b+ CD16+ cells (C) in PBMCs from HDs (n = 9 to 11) and acutely (n = 11 to 21) and chronically (n = 11 to 21) T. gondii-infected patients. Each pair connected by a line represents a single individual. (D) Representative transmission electron microscopy images from a T. gondii active infection and a T. gondii opsonized infection of neutrophils from HDs. Bars, 500 nm. (E) Expression of CD66b, CD11b, CD15, CD62L, and CD88 by neutrophils from HDs in medium alone (n = 6 to 13) or stimulated with T. gondii tachyzoites (n = 6 to 14). (F) Relative expression of CD66b by neutrophils from HDs in medium alone or stimulated with T. gondii tachyzoites without (Tg) or with (Tg+MycB) mycalolide B pretreatment (n = 6). (G) Percentage of neutrophils infected for 4 h with T. gondii or T. gondii pretreated with mycalolide B (3 μM, 30 min) (n = 6). (H) Relative CD66b expression in the different subpopulations (Tg positive and negative) from panel G. (I) Representative immunofluorescence microscopy and (J) scatter dot plots (n = 6) of neutrophils from HDs in medium alone (Control), exposed to T. gondii RH expressing YFP with or without pretreatment with mycalolide B (3 μM, 30 min), or stimulated with 25 nM Phorbol 12-myristate 13-acetate (PMA) for 3 h. Cells were stained with Hoechst and anti-human neutrophil elastase (NE). Bars, 25 μm. (K) Neutrophil extracellular ROS production was measured by chemiluminescence (relative light units [RLU]) for 60 min in neutrophils from HDs that were unstimulated (n = 5) or stimulated with T. gondii (n = 5). The differences are relative to the control. The T. gondii-neutrophil ratio was 3:1. Data are medians and interquartile ranges. *, 0.05 > P > 0.01; **, 0.01 > P > 0.001; ***, 0.001 > P > 0.0001; ****, P < 0.0001; ns, not significant.

