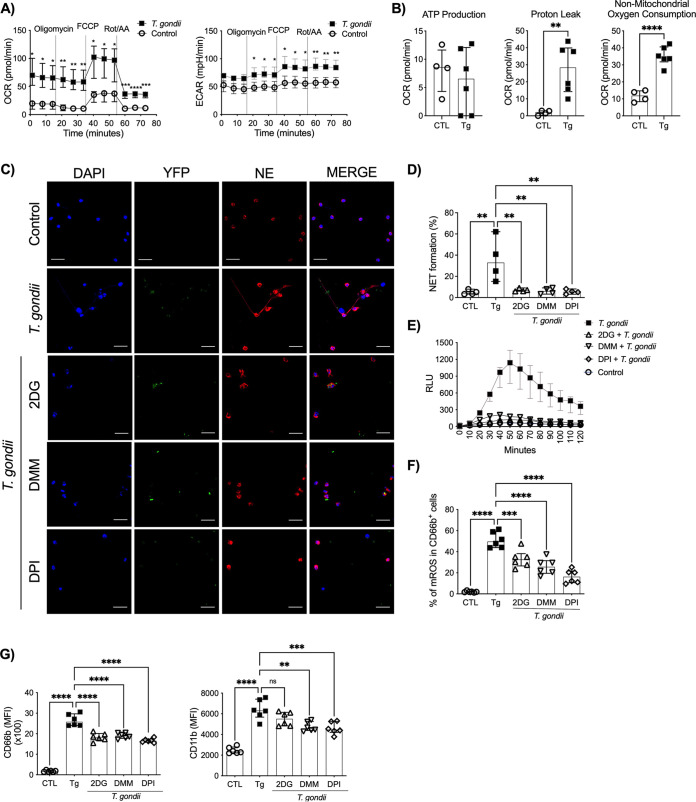
FIG 2.
T. gondii-induced NETs are dependent on glucose and mitochondrial metabolism. OCR and ECAR (A) and ATP production, proton leakage, and nonmitochondrial oxygen consumption (B) were measured in neutrophils from HDs that were unexposed (n = 4 or 5) or exposed to T. gondii (n = 6). Representative immunofluorescence microscopy (C) and scatter dot plots (n = 4) (D) of neutrophils from HDs cocultured with the T. gondii YFP-expressing RH strain in the presence or absence of the metabolic inhibitors 2-DG (2 mM), DMM (10 mM), and DPI (5 μM). Cells were stained with DAPI and anti-human NE. Bars, 25 μm. (E) Kinetics of ROS production by neutrophils from HDs stimulated with T. gondii RH (T. gondii-neutrophil ratio, 3:1) or left unstimulated in the presence or absence of the inhibitors 2-DG (2 mM), DMM (10 mM), and DPI (5 μM) (n = 5). Luminol was measured by chemiluminescence (relative light units [RLU]) for 60 min. (F) Mitochondrial ROS were assessed by measuring MitoSox by flow cytometry in neutrophils from HDs exposed to T. gondii RH or left unexposed in the presence or absence of the metabolic inhibitors (n = 6). (G) MFI scatterplots of CD66b (left) and CD11b (right) in neutrophils from HDs cocultured with T. gondii tachyzoites or not cocultured in the presence or absence of the metabolic inhibitors (n = 6). Data are medians with interquartile ranges. *, 0.05 > P > 0.01; **, 0.01 > P > 0.001; ***, 0.001 > P > 0.0001; ****, P < 0.0001; ns, not significant.

