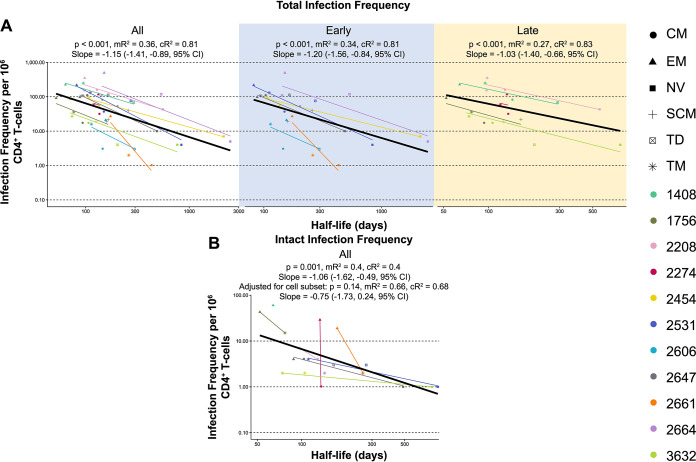
FIG 2.
Infection frequency versus cellular half-life. (A) Mixed-effects modeling of total infection frequency per 106 cells versus cellular half-life (days) for all participants and early and late ART treatment groups. (B) Mixed-effects modeling of intact infection frequency per 106 cells versus cellular half-life (days) for all participants. The black line depicts simple regression analysis. P values and R2 values can be found for all participants and each ART treatment group. Two R2 values are calculated for this model, mR2 (marginal) and cR2 (conditional), which are similar to a linear regression comparing the relationship between half-life and infection frequency for individual participants or the population as a whole. Marginal R2 is calculated using all the data points on the graph regardless of participant, whereas the conditional R2 accounts for participant variability. The slopes and 95% CIs are reported for the population-wide trend.

