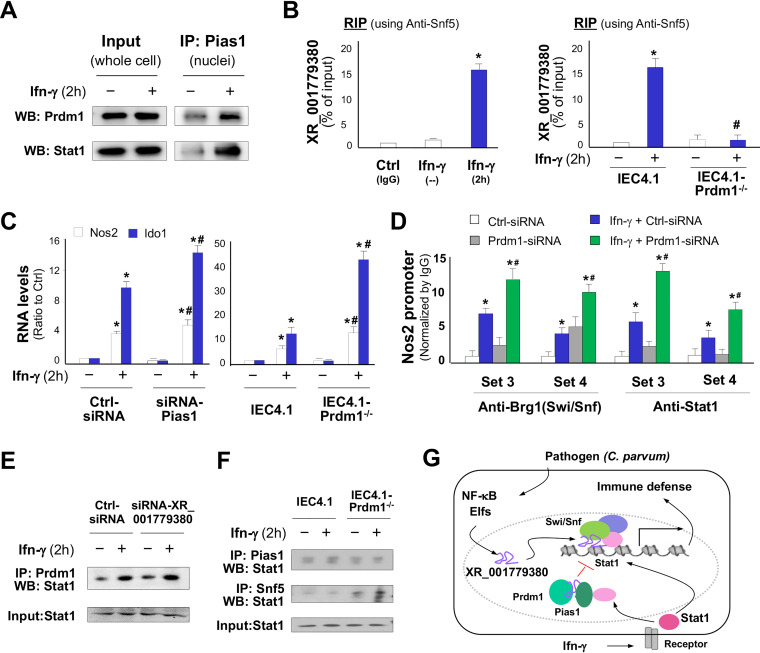
FIG 7.
Prdm1 interacts with XR_001779380 to attenuate IFN-γ-mediated antimicrobial defense in neonatal intestinal epithelium. (A) Physical association of Prdm1 with Pias1 in the nuclei extracts of IEC4.1 cells induced by IFN-γ, as measured by co-IP. Whole-cell extracts were used as the input control. (B) Assembly of XR_001779380 to the Prdm1/Pias1 complex induced by IFN-γ in IEC4.1 cells, as assessed by RIP assay with anti-Pias1 (anti-IgG as the control). IFN-γ-induced assembly of XR_001779380 to the Prdm1/Pias1 complex was not detected in IEC4.1-Prdm1−/− cells. (C) Knockdown of Pias1 or Prdm1 in IEC4.1 cells resulted in an increased expression of Nos2 and Ido1 in response to IFN-γ stimulation. (D) siRNA knockdown of Prdm1 resulted in a significant increase in the recruitment of the Swi/Snf/Stat1 complex to the Nos2 promoter region in IEC4.1 cells in response to IFN-γ, as revealed by ChIP analysis using anti-Brg1 or anti-Stat1. (E) Knockdown of XR_001779380 showed no effects on the assembly of Stat1 to the Prdm1/Pias1 complex, as revealed by co-IP analysis using anti-Prdm1 for immunoprecipitation and anti-Stat1 for Western blotting. (F) Knockdown of Prdm1 in IEC4.1 cells decreased the assembly of Stat1 to the Pias1 complex but increased the assembly of Stat1 to the Swi/Snf complex in response to IFN-γ stimulation. IEC4.1 and IEC4.1-Prdm1−/− cells were treated IFN-γ for 2 h, followed by co-IP analysis using anti-Pias1 or anti-Snf5 for immunoprecipitation and anti-Stat1 for Western blotting, respectively. (G) Model of XR_001779380 in IFN-γ-induced epithelial cell antimicrobial defense. Induction of XR_001779380 primes epithelial cells for IFN-γ-mediated antimicrobial gene transcription through modification of Stat1/Swi/Snf-mediated chromatin remodeling. Prdm1 may suppress IFN-γ-mediated antimicrobial defense through its interaction with Pias1 and XR_001779380, contributing to the higher susceptibility to infection in infants. Data are shown as the means ± SD from at least three independent experiments. Representative gel images from three independent experiments are shown in panels A, E, and F. Statistical significance (ANOVA test): *, P < 0.01 versus non-IFN-γ-treated control; #, P < 0.01 versus IFN-γ-treated group.

