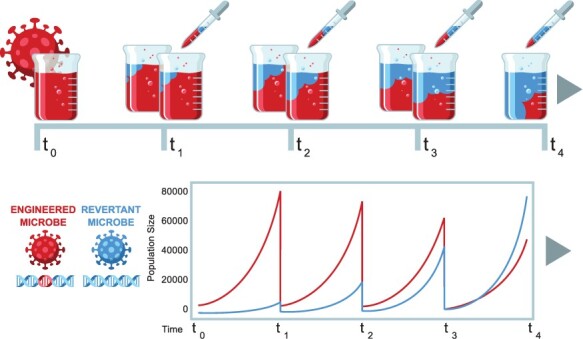
Figure 1.

A schematic of the experimental design, genetic engineering, and evolutionary dynamics assumed by our maximum likelihood method. The top row depicts four serial transfers of a microbe, with the frequency of the engineered type (red) declining in each passage relative to the revertant microbe (blue) that has lost the engineering/insert. The lower row plots the densities of engineered and revertant strains. Microbe densities (numbers) increase over time within a culture, then are diluted precipitously at transfer, but continue growing at the same rate and eventually repopulate the new culture, only to be diluted again. The increase in frequency of the revertant strain is evident from the gradual rise to dominance of the blue curves. The transfers may continue indefinitely.
