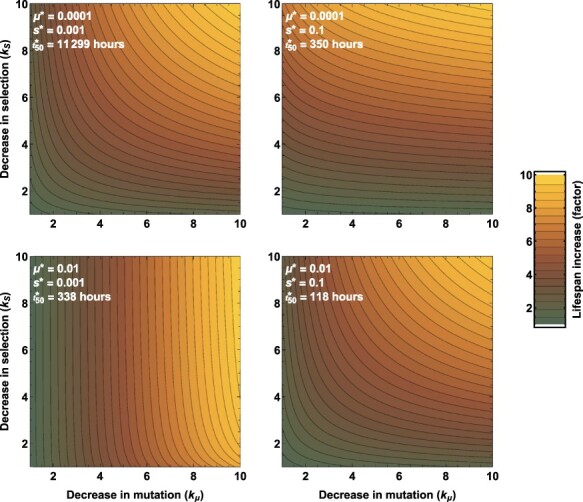
Figure 2.

Contour plots showing how decreasing mutation rates and selection against a transgene influence the longevity of the engineering. For each panel, the starting values of mutation ( ) and selection (
 ) yield the half-life value indicated (
 ). The value of
  given in the figure applies to the lower left corner, a color value of 1 in the key at the right. As the value of mutation or selection is decreased by the factor given on the respective axis (e.g. mutation is
  and selection is
  ), the t50 value increases (the engineering persists longer) by the factor indicated in the key. Panels show a nearly 10-fold increase in longevity in the upper right corner, but the separate effects of kµ and ks vary across panels as indicated by the contour lines being vertical or horizontal.
