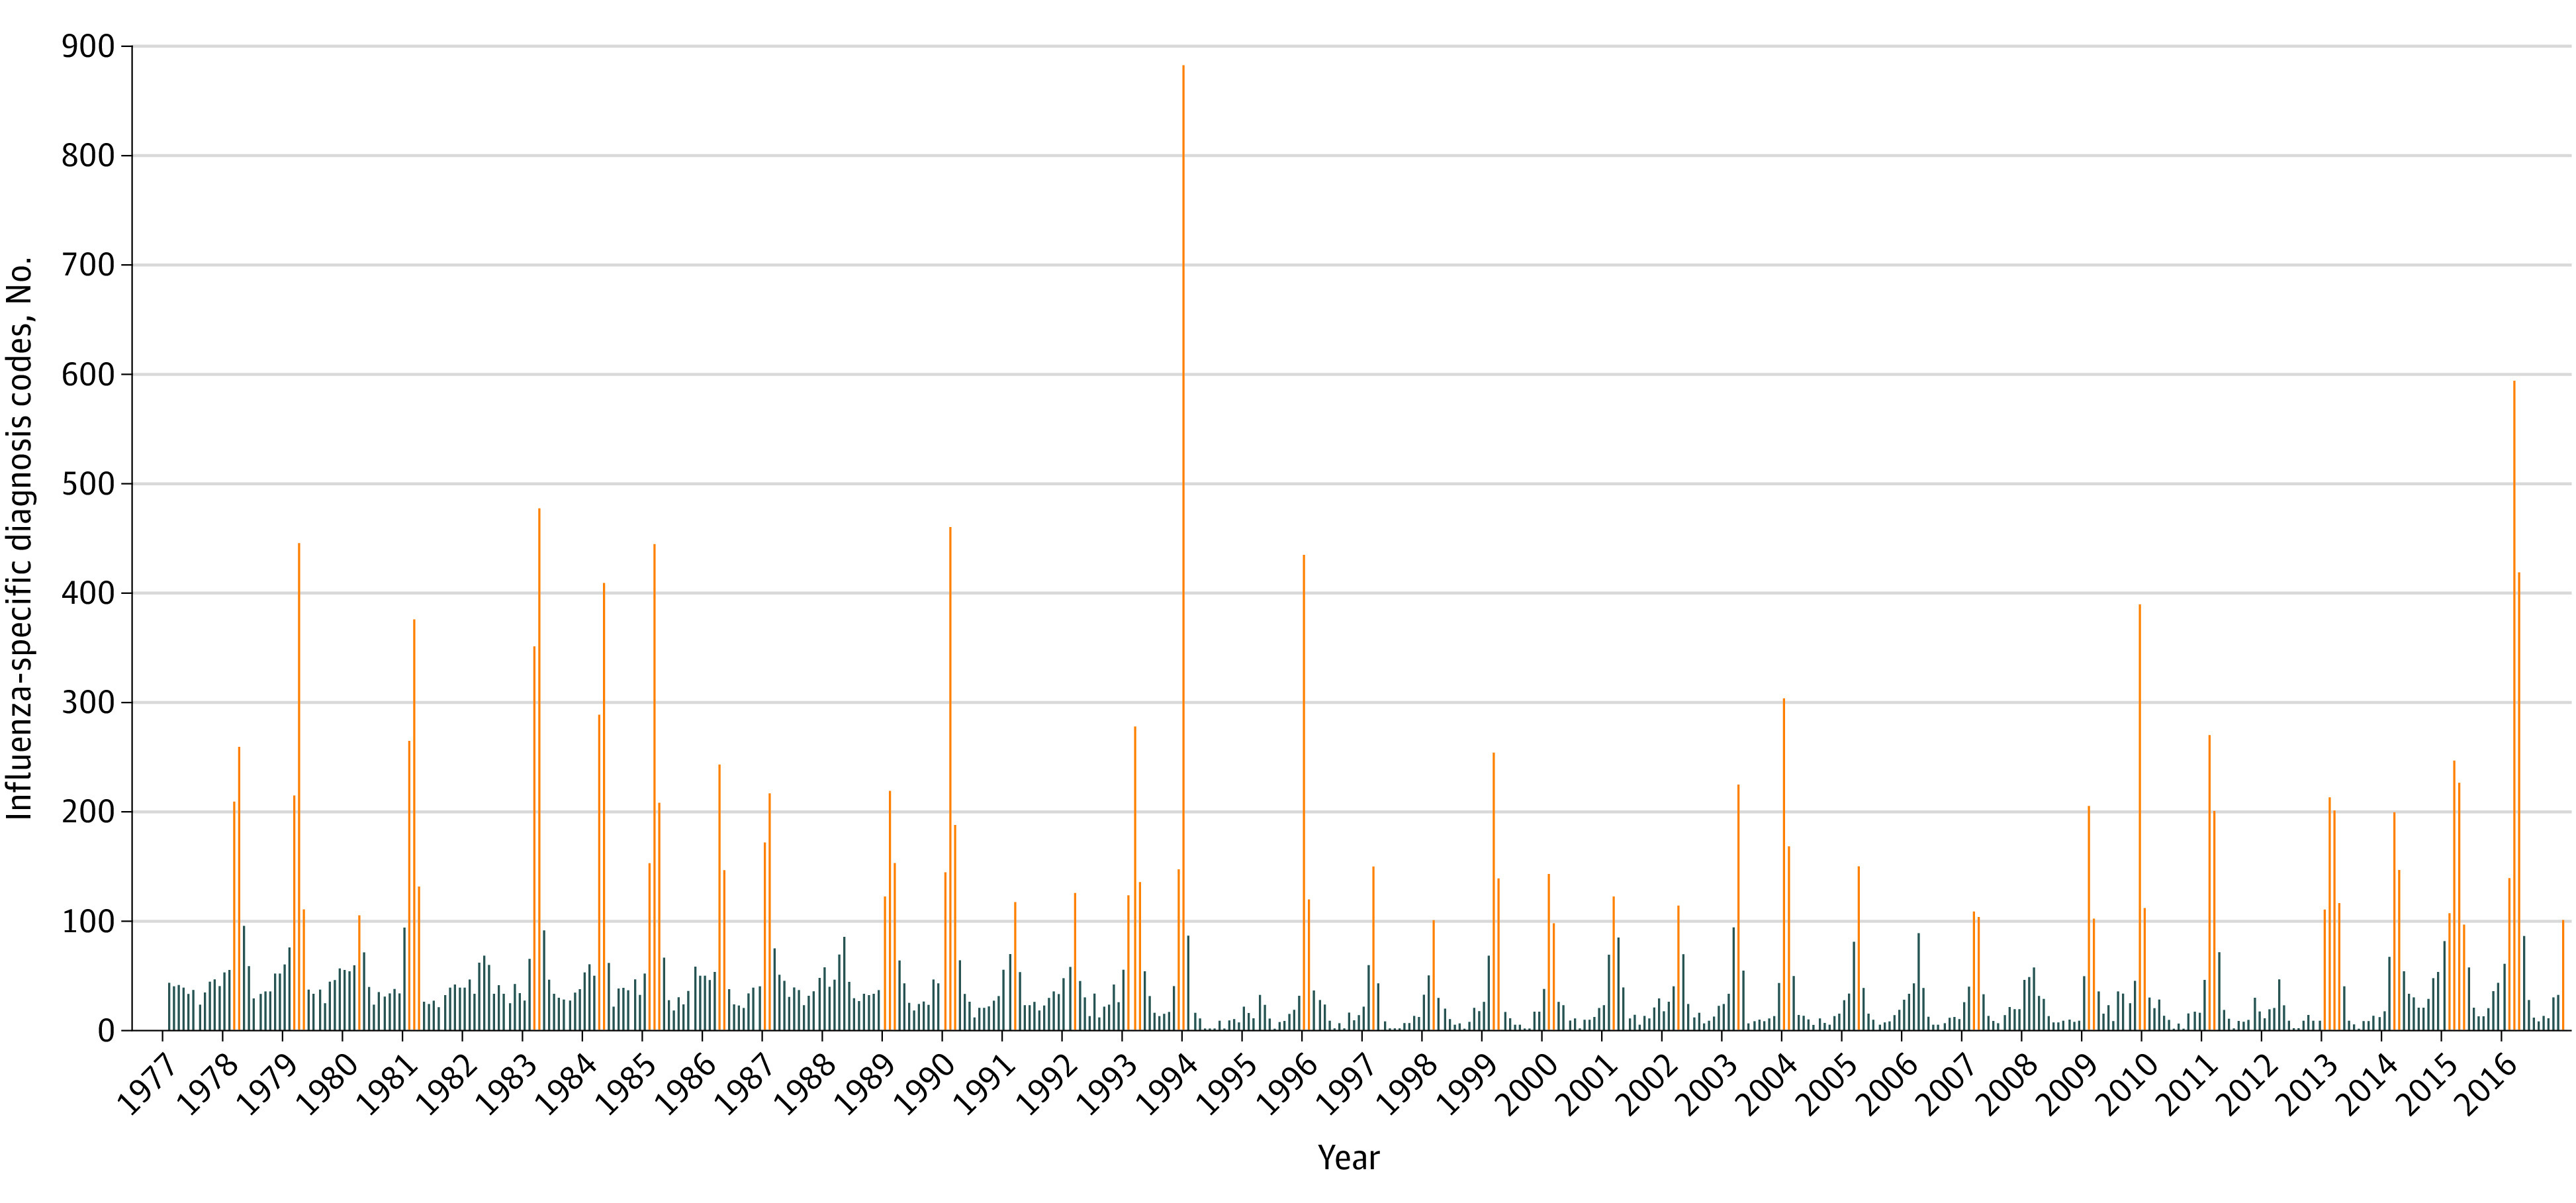
Figure 1. Counts of Influenza-Related Diagnoses in the Danish National Patient Registry by Year, 1977 to 2016.

Counts of influenza-specific diagnosis codes from 1977 to 2016. Each bar represents a month. Orange indicates months of increased influenza activity, and blue indicates months when influenza activity was not increased. Diagnosis codes can be found in eAppendix 2 in the Supplement.
