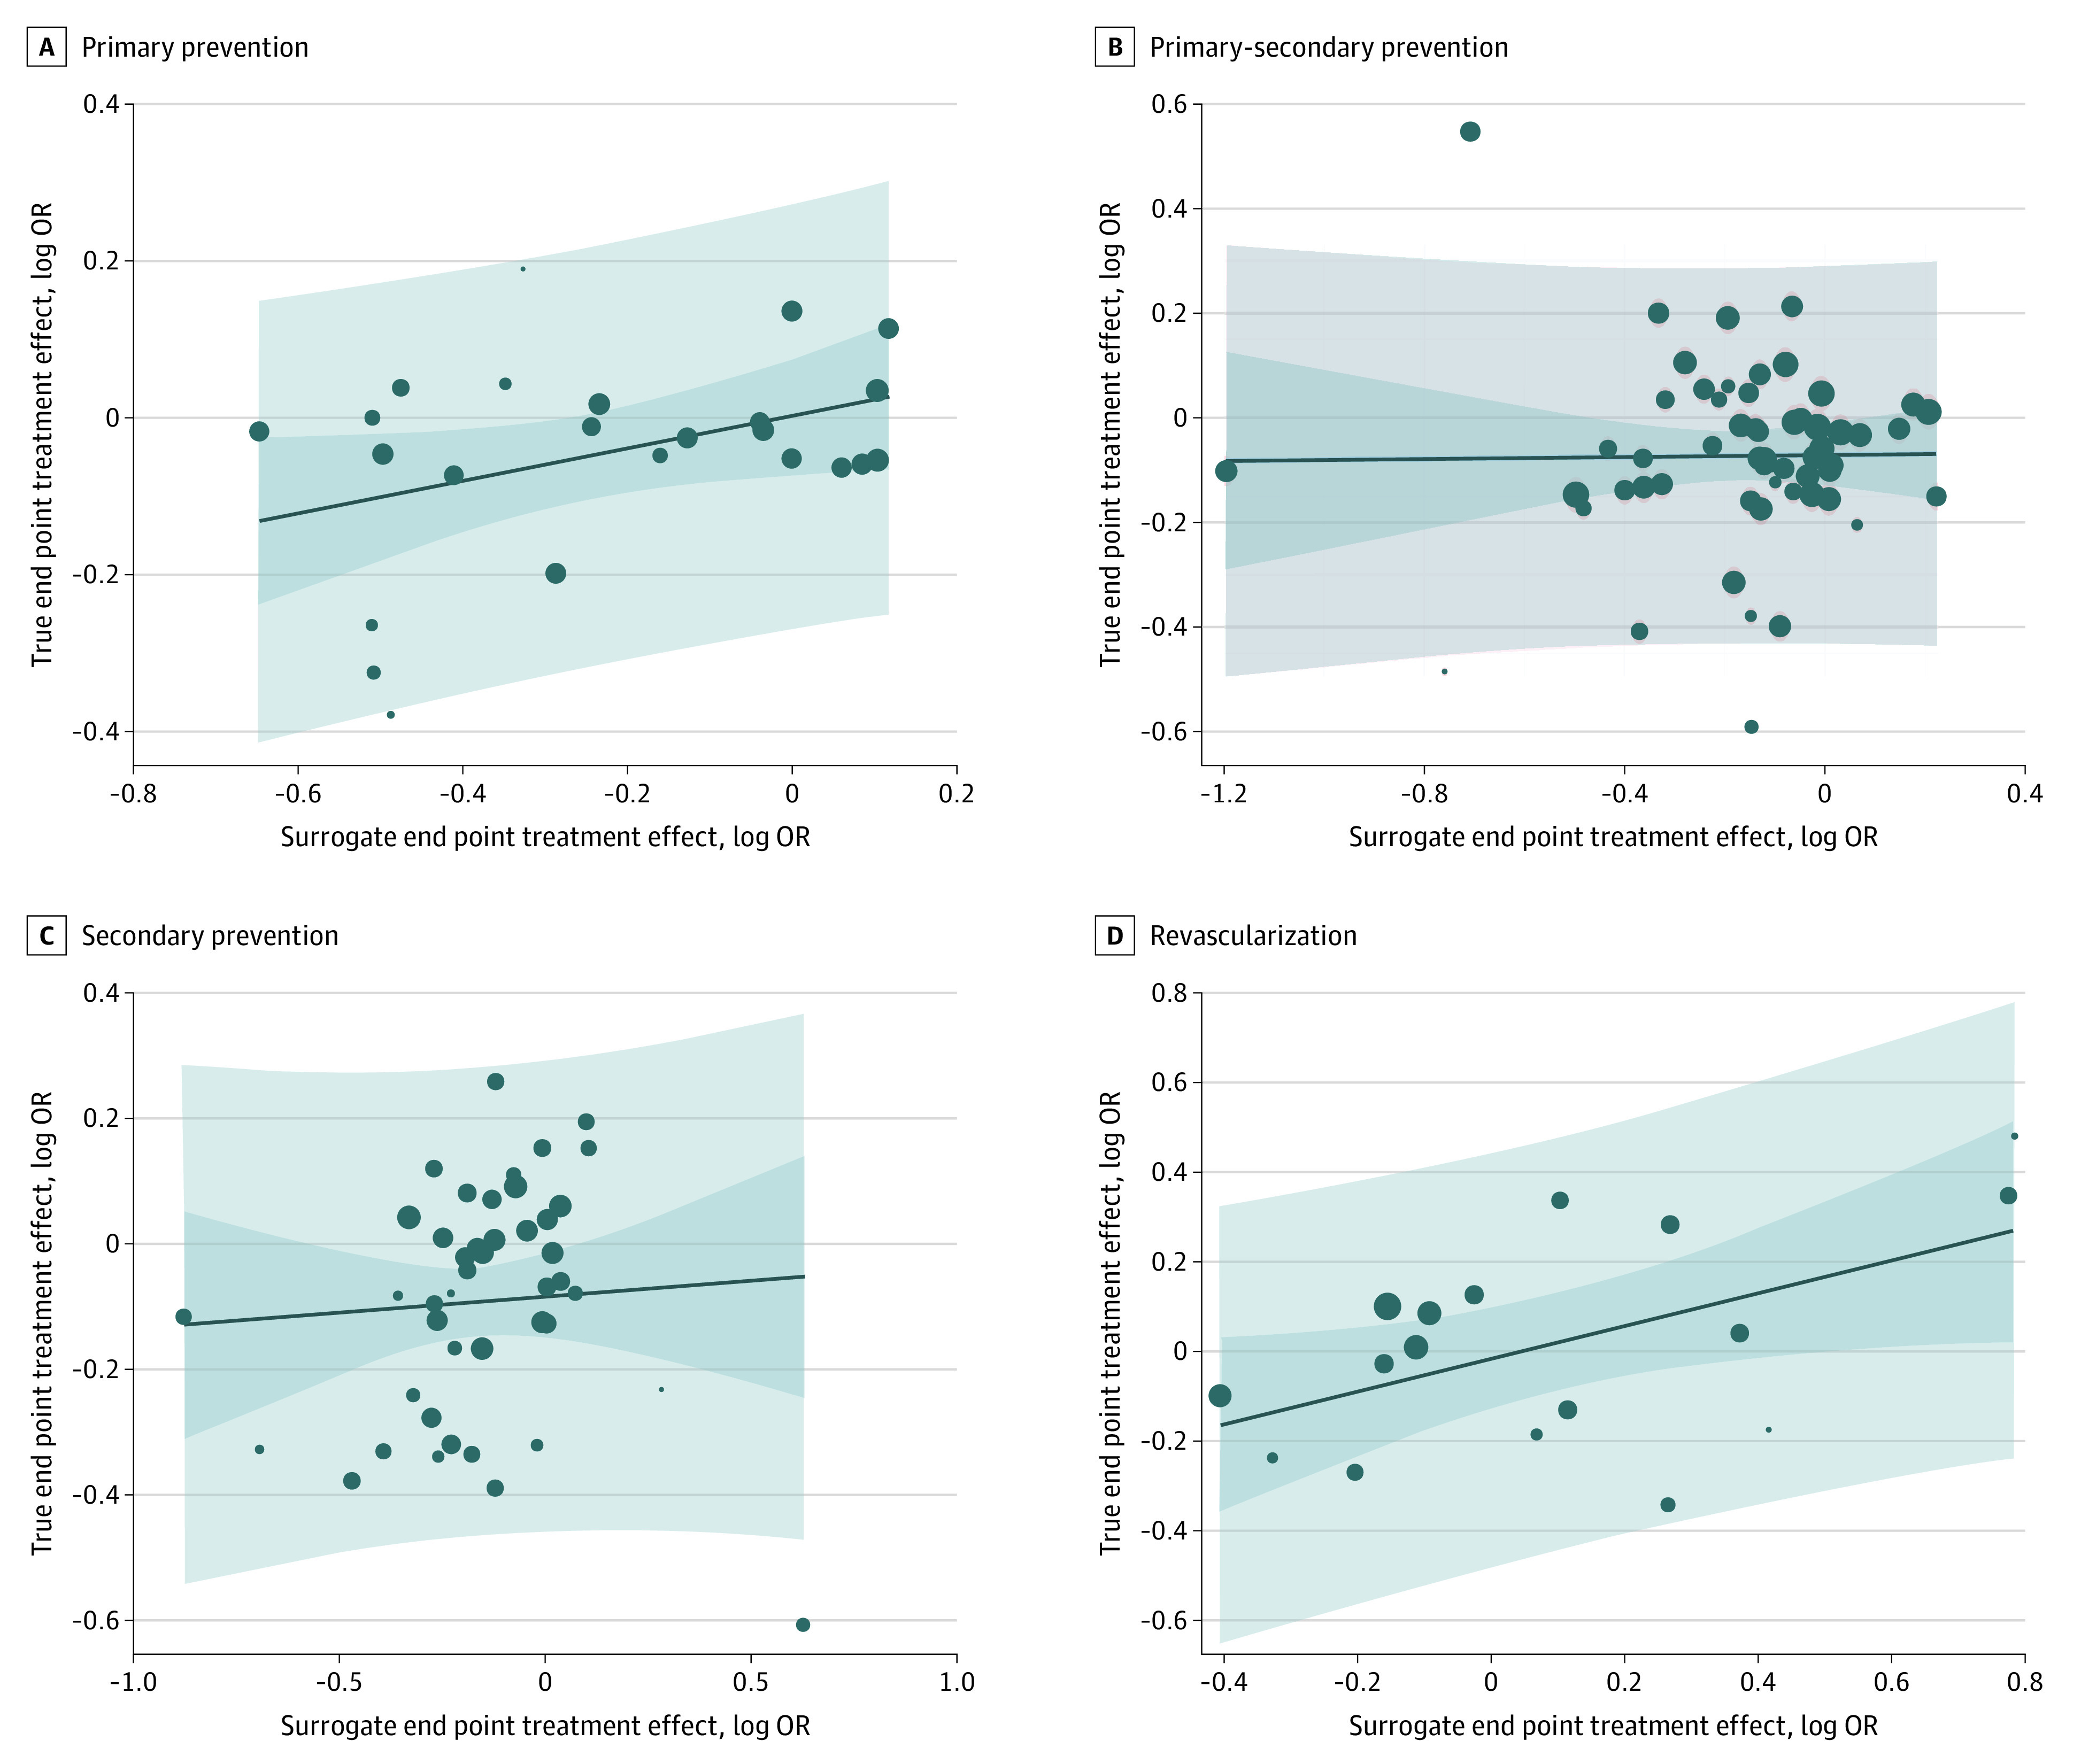
Figure 3. Subgroup Analysis by Study Subject for the Association Between the Logarithm of the Odds Ratios (Log ORs) for the End Points.

Surrogate end point of nonfatal myocardial infarction and the true end points of all-cause mortality primary prevention (A), mixed primary-secondary prevention (B), secondary prevention (C), and revascularization (D). The dark blue area represents the 95% CI for the regression line (solid blue), light blue area represents the 95% prediction interval, and circle size is proportionate to the number of observations.
