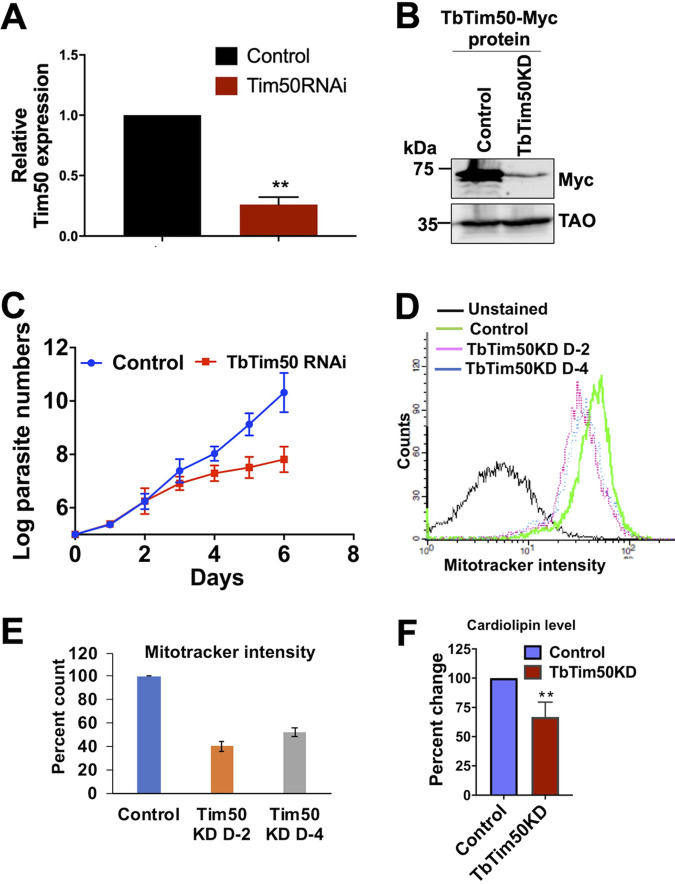
FIG 3.
TbTim50 depletion inhibits BF cell growth and reduces cardiolipin levels and mitochondrial ΔΨ. (A) Reverse transcription-PCR (RT-PCR) analysis of the TbTim50 transcript levels in TbTim50-Myc (control) and TbTim50-Myc/TbTim50 RNA interference (RNAi) cells after 48 h of induction with doxycycline. The levels of the target transcript were normalized with the levels of tubulin transcript in each sample, and the normalized value for control was considered 100%. (B) Immunoblot analysis of total proteins from TbTim50-Myc (control) and TbTim50-Myc/TbTim50 RNAi (TbTim50 KD) cells grown in the presence of doxycycline for 48 h were probed with anti-Myc antibody. TAO was used as the loading control. (C) Growth curve for TbTim50-Myc (control) and TbTim50-Myc/TbTim50 RNAi (TbTim50 KD) cells grown in the presence of doxycycline. Cell numbers were counted each day for 6 days postinduction. Cells were reinoculated when the parasite number reached 1 × 10⁶ cells/ml. The log of the cumulative cell number was plotted against the number of days postinduction. Standard errors were calculated from three experiments. (D) Effect of TbTim50 KD on mitochondrial ΔΨ. TbTim50-Myc (control) and TbTim50-Myc/TbTim50 RNAi (TbTim50 KD) cells (1 × 10⁷) were harvested at 2 (D2) and 4 (D4) days postinduction and stained with MitoTracker red. Fluorescence intensity was measured with a FACSCalibur (Becton, Dickinson) analytical flow cytometer using absorption at 578 nm and emission at 599 nm. FlowJo software was used to analyze the results. (E) Quantitation of the fluorescence intensity from triplicate samples was performed. Fluorescence intensity of the control was considered 100%. (F) Change in the CL content in BF T. brucei due to Tim50 depletion. CL levels were measured in the cell lysate of control and Tim50 KD cells, as described in Materials and methods. Values shown are means ± standard errors from triplicate samples. Significance values were calculated by t test and are indicated by asterisks (**, P < 0.01).

