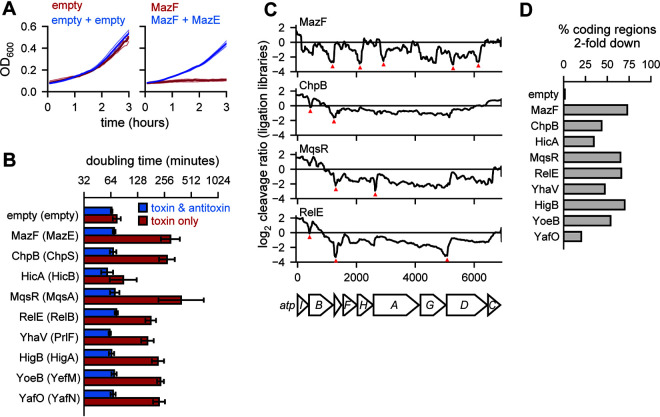
FIG 1.
Endoribonuclease toxins inhibit cell growth and broadly cleave the transcriptome. (A) Sample growth data for cells harboring two empty vectors (left) or toxin (MazF)- and antitoxin (MazE)-containing vectors. Toxin was induced (red) or toxin and antitoxin were coinduced (blue) at time zero. Three replicates (faded lines) were used to calculate the mean (solid lines). (B) Doubling times calculated from growth curves like those in panel A using data between 30 min and 2 h for cells expressing a given toxin (red) or toxin and antitoxin (blue). Error bars show the standard deviation of 3 replicates. (C) Cleavage profiles of the highly expressed atpI-C region are plotted for four toxins. Selected narrow valleys are highlighted with red triangles. All toxins were expressed for 10 min with the exception of MazF, which was expressed for 5 min. Data shown are from a single ligation RNA-seq library for each toxin compared to a single empty vector library. (D) The percentage of highly expressed (all positions with ≥64 reads in the vector control) coding regions in E. coli with at least one position having a cleavage ratio below −1, or a relative 2-fold downregulation of RNA abundance at the site, after expression of each toxin indicated. Data are from ligation libraries, as in panel C.

