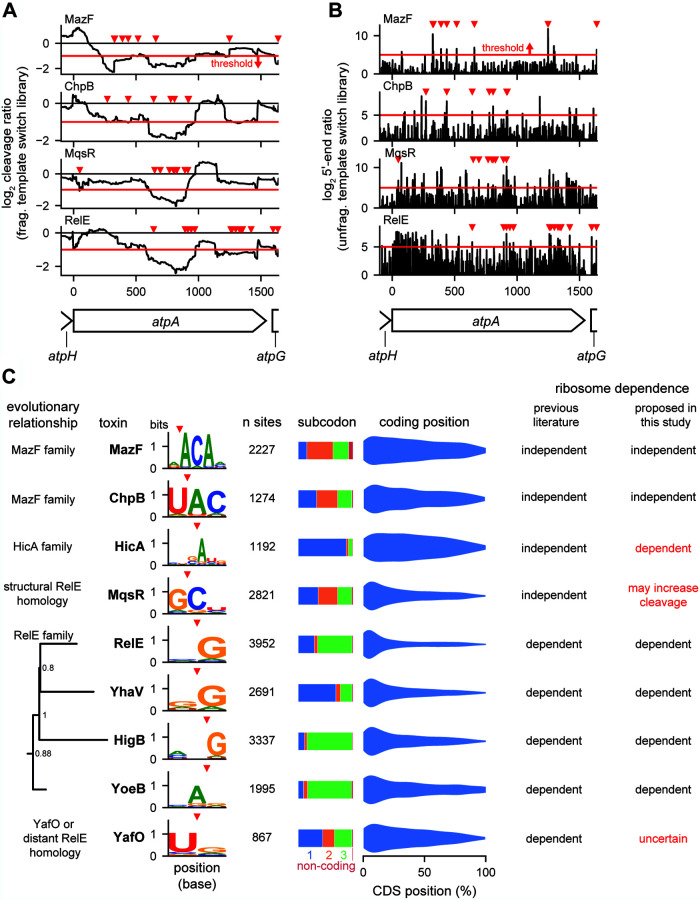
FIG 3.
Cleavage specificities of 9 endoribonuclease toxins. (A and B) Cleavage profiles (A) and 5′-end ratios (B) from template switch libraries of the highly expressed atpA gene are plotted for the four toxins indicated. Each toxin was expressed for 5 min. Data are means for 2 replicates for each toxin and empty vector control. Peaks that were identified as cleavage sites with the thresholds described in for panel C are marked with red triangles. Thresholds for cleavage ratio and 5′-end ratio are shown as red lines. (C) Summary of cleavage specificities identified for each toxin in expressed non-rRNA regions using a combination of fragmented and unfragmented template switch libraries. Sites (cleavage site plus 10 upstream nucleotides) were required to meet a minimum expression threshold of 64 reads at all positions. Sites were called as peaks if the 5′-end ratio was ≥32 at the cleavage site with a ≤2-fold decrease in read density of the fragmented library in the region upstream of the cleavage site. Nucleotides with ≥0.05 bits of information were included in the motifs shown. Evolution tree of RelE family built using 1,144 protein sequences, with only E. coli sequences shown.

