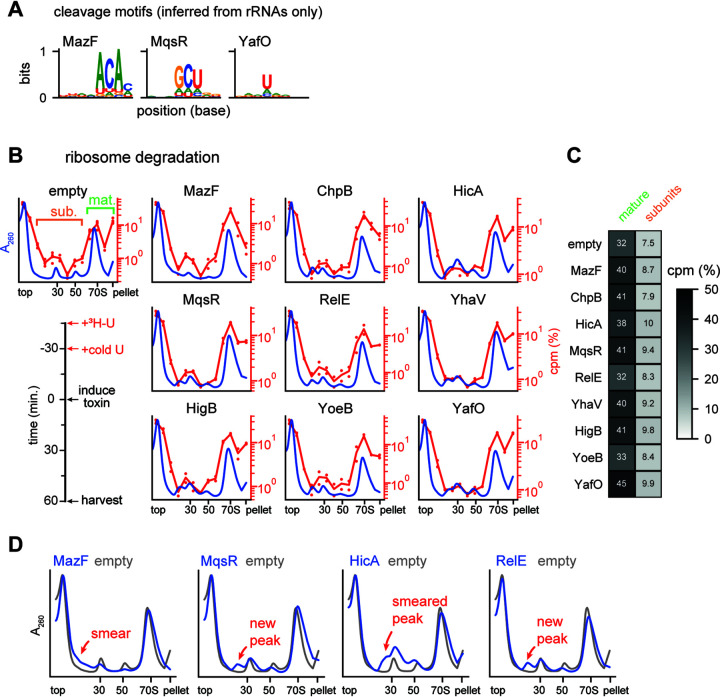
FIG 5.
Mature ribosomes are not a target of toxins. (A) Cleavage motifs identified from the peaks within rRNA and rRNA precursor regions after 30 min of toxin expression. Toxins broadly matching the motif defined in Fig. 3C are shown here, with toxins that did not match shown in Fig. S2A. (B) Sucrose gradients showing effect of toxin expression on mature ribosomes. The timeline of the experiment is shown on bottom left. Average A260 values are plotted in blue (empty vector, n = 8; each toxin, n = 4). Numbers of counts per minute for 3H are plotted on the right axis as a percentage of total signal (empty vector, n = 4; each toxin, n = 2); dots show the values for each replicate, with lines showing averages. (C) Summed 3H signal from the mature ribosome and precursor fractions from panel B. Mature and subunit fractions are defined on the empty vector sample in panel B. (D) Average A260 values for selected toxins compared to the empty vector sample from panel B are enlarged relative to panel B to highlight changes from toxin expression. The location of smears and peaks relative to the empty vector are highlighted.

