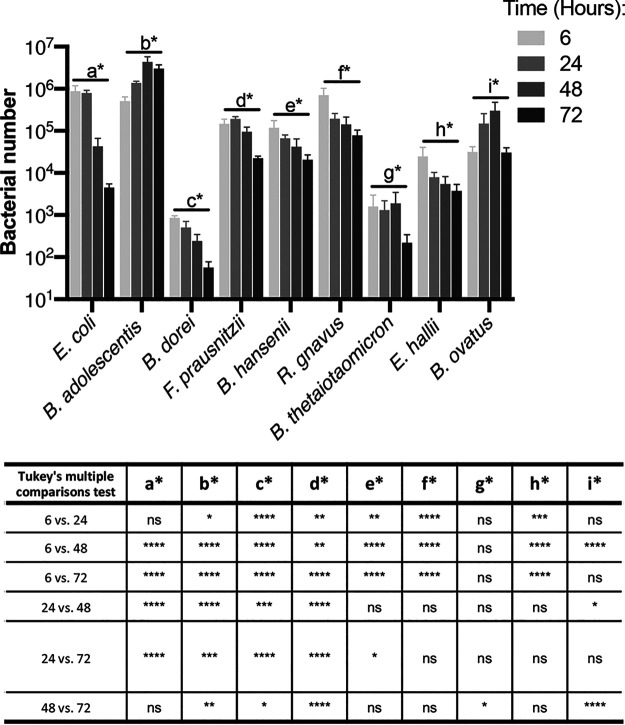
FIG 2.
A nine-species gut microbial community tracked over time. Species-specific changes in bacterial numbers within a mixed biofilm were tracked using PMA-qPCR. CT values were converted using our pipeline to represent total bacterial numbers. Bacterial numbers for individual species within the mixed biofilm at 6, 24, 48, and 72 h are shown in the graph. The table below summarizes the significant differences across time for the different species as calculated by ANOVA, with post hoc Tukey’s multiple-comparison test. P values: ns, not significant; ****, <0.0001; ***, <0.001; **, <0.01; *, <0.05. Data shown are the mean from three independent biological experiments done in in triplicate. Error bars indicate the standard deviation.

