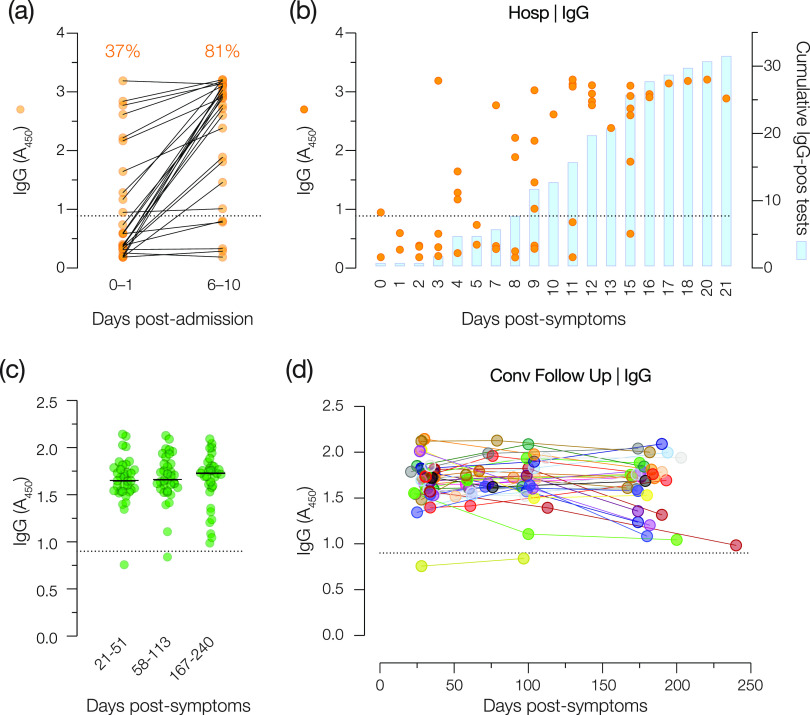
FIG 6.
Longitudinal analysis of spike-specific IgG reactivity early in infection and up to 6 months after symptom onset. (a) Serum samples from patients at two time points following hospital admission were analyzed for spike-specific IgG. Percentages of positive samples are shown above each time point. (b) Individual patient samples (circles) and cumulative positive results (blue bars) graphed as a function of days after symptom onset. Data from two independent experiments (n = 4) are shown. (c and d) Serum samples collected from Conv cohort patients at two subsequent time points (∼100 and ∼180 days after symptom onset) were examined for spike-specific IgG reactivity. (c) Patient samples clustered by time of collection (days after symptom onset). (d) Longitudinal trends for individual patients. Data are from a single representative experiment (n = 2). The diagnostic threshold for IgG is depicted as a dotted line in each graph (A450 = 0.90).

