FIG 1.
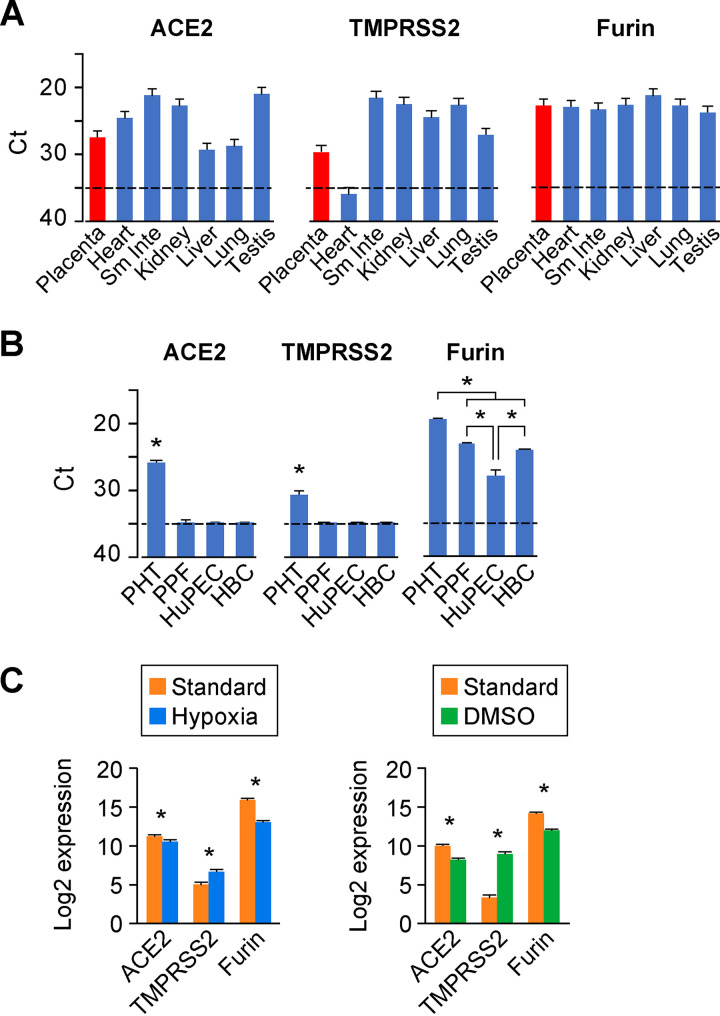
The expression landscape of ACE2, TMPRSS2, and furin in the human placenta and placental cells. (A) The expression of the processing proteins in human organs (Sm Inte, small intestine). Transcripts of ACE2, TMPRSS2, and furin were detected by RT-qPCR using the FirstChoice Human Total RNA Survey Panel. Expression levels are shown by threshold cycle (Ct) values in various human organs. n = 3. (B) The expression of the processing proteins in primary human placental villous cells. Data are derived from cultures of the major primary human placenta cells, including trophoblasts (PHT), fibroblasts (PPF), endothelial cells (HuPEC), and Hofbauer cells (HBC). Expression (mRNA), detected by RT-qPCR, is shown by Ct values. n = 3. *, P < 0.01, ANOVA with post hoc Bonferroni test. For panels A and B, the dashed line represents the assay threshold for the presence of each transcript. Note that lower Ct values indicate higher expression. (C) The expression of the processing proteins in cytotrophoblasts versus syncytiotrophoblasts. Standard/hypoxic conditions (left) and culture in the presence of 1.5% DMSO (right) were performed and analyzed as described in Materials and Methods. RNA-seq data (n = 5) are expressed as log2 value. *, P < 0.01.

