
FIG 4.
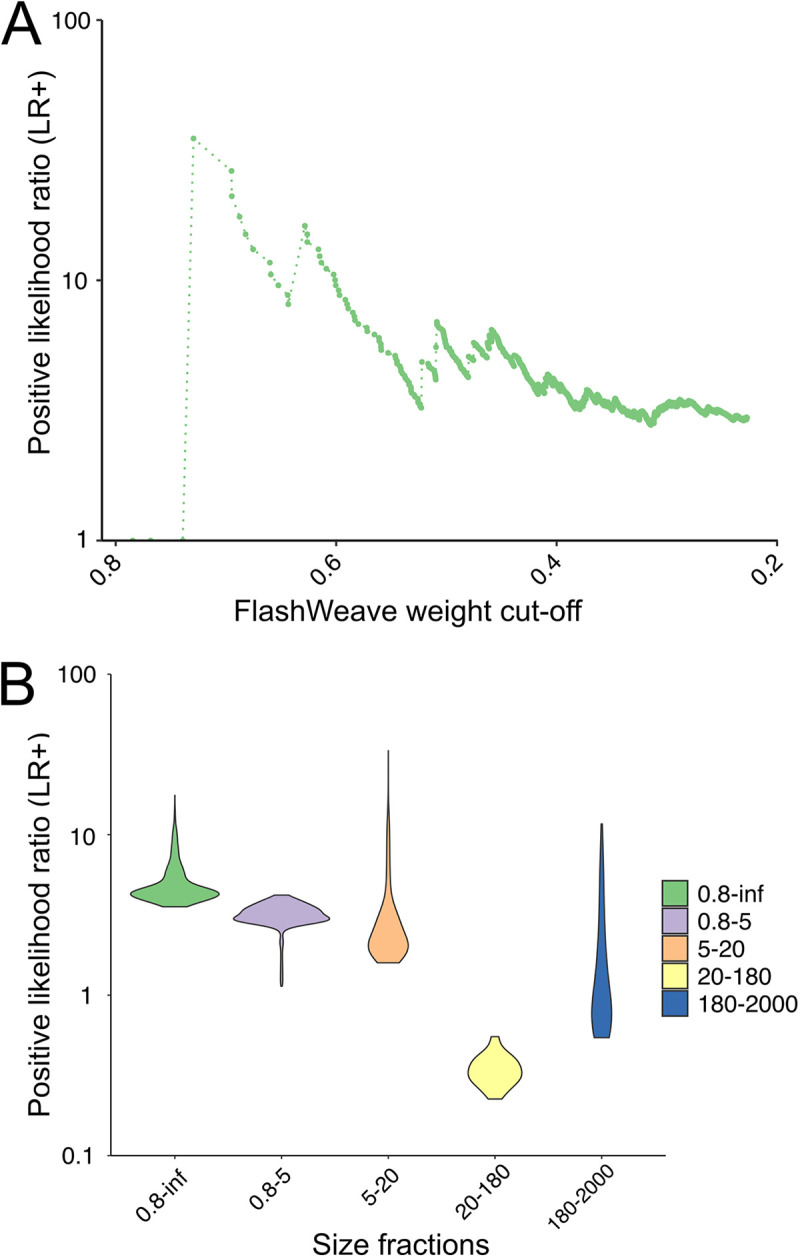
Positive likelihood ratios (LR+) in the NCLDV virus-host validation. (A) General performance of co-occurrence networks is shown with the LR+ calculated with associations pooled from five size fractions networks. To show the relationship between LR+ and FlashWeave association weight, the LR+ values are plotted by dots and connected by a dashed line along with the association weight. (B) Performance of each size fraction network is shown with the violin plot by ggplot2 with a bandwidth of 2. Size fractions are presented in μm.