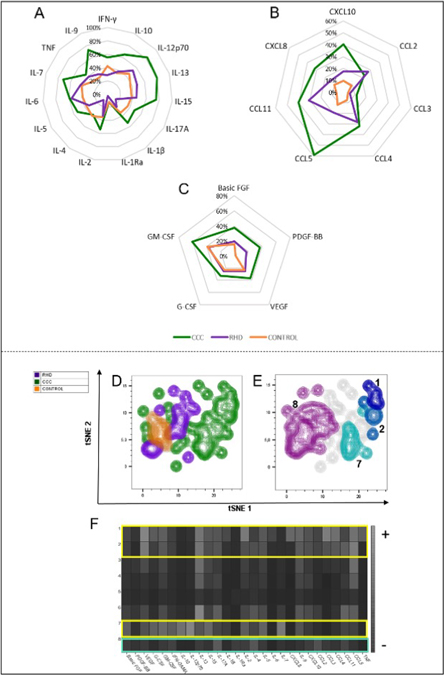
Fig. 3. General profile of the evaluated soluble factors represented by radar graphs and tSNE analysis.
Representative analysis by radar chart with the median plasma levels of (A) cytokines, (B) chemokines and (C) growth factors in samples from CONTROL group (orange line), patients with CCC (green line) or RHD (purple line). (D) Generated tSNE map, showing the stratification between the different groups evaluated after overlapping on the islands formed by the algoritm. (E) Clusters detected by the FlowSOM analysis and projected on the tSNE map to identify the distribution within the groups evaluated. (F) Heat map representation of the relative intensity expression of the molecules performed by the cluster explorer algorithm.

