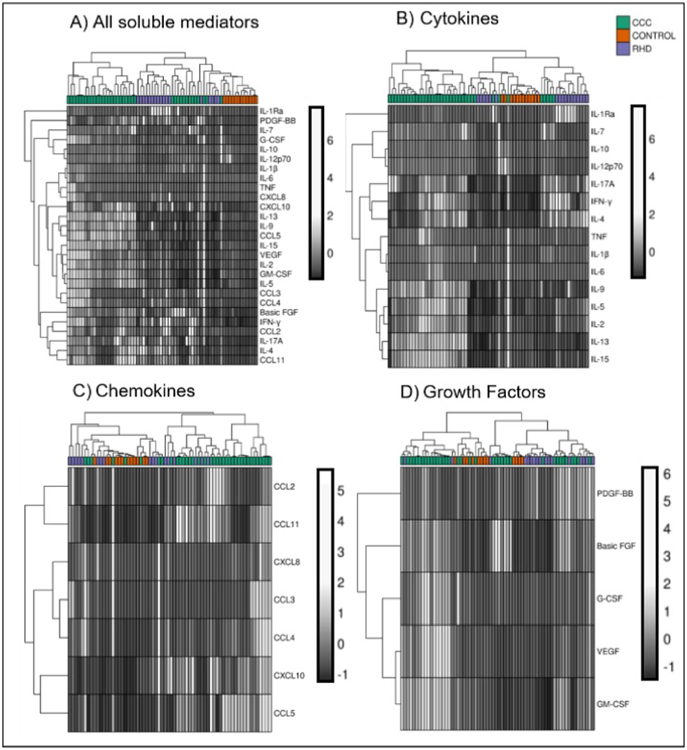
Fig. 5. Cluster analysis of the soluble immune mediators.
(A) Heatmap representation of the plasma levels of all soluble mediators evaluated; and individual analysis by group of molecules: (B) cytokines, (C) chemokines, and (D) growth factors in samples from CONTROL group (n = 12), patients with CCC (n = 38) or RHD (n = 17). Both rows and columns are clustered using correlation distance and average linkage. Light gray indicates higher plasma levels, while dark grey indicates lower plasma level.

