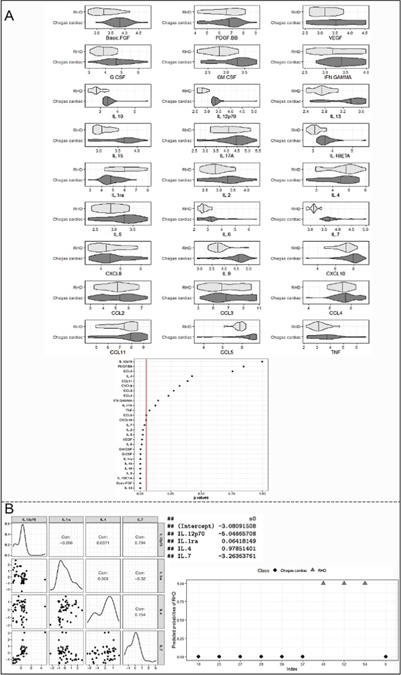
Fig. 6. Identification of predictors of immunological segregation between heart diseases.
(A) Violin Plot depict the relationship of each molecule in the study groups (Chagas cardiac and RHD); p-values are shown in bottom graph (B) marginal distribution of the selected covariates and their correlations. In the main diagonal of the figure, graphs of the marginal distribution (smoothed) of each covariate are presented, while below the diagonal, scatter plots are represented for each pair. Above the diagonal, the estimated correlations are shown. Coefficient values S0 are shown on the side. Graph on the right-hand side shows the discrimination between CCC (diamonds) and RHD (triangles) patients, based on the expression of IL-12p70, IL-1Ra, IL-4 and IL-7. Y-axis shows the predicted probability of RHD and X-axis displays the individual patient ID.

