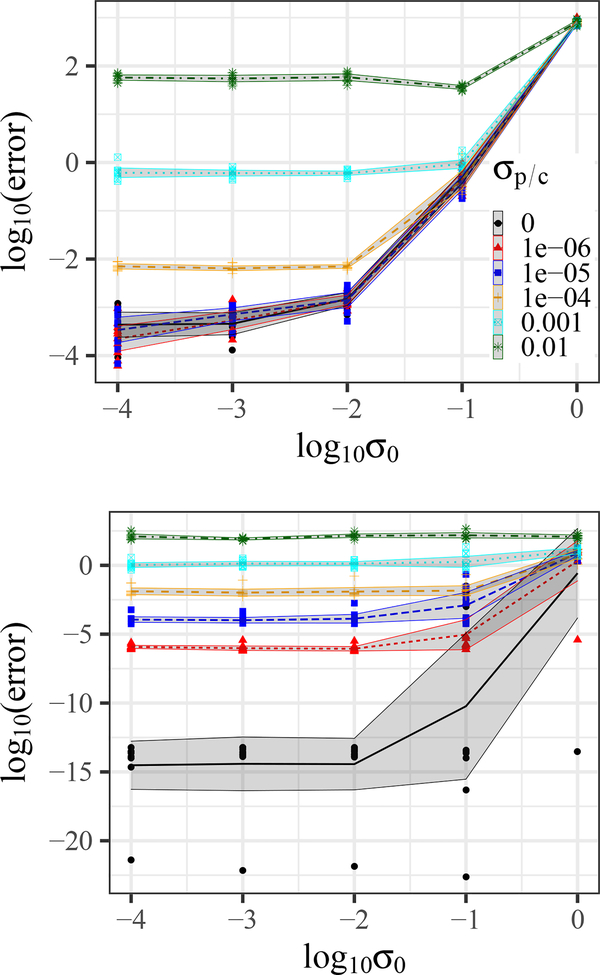
Figure 3:
OTTER recovery error using (top) gradient descent and (bottom) spectral decomposition for artificial networks of size np = 100, nc = 200 and Gaussian noise with variance for P and C and for W0. Shaded regions correspond to the 0.95 confidence interval and lines to the average over 10 repetitions. The legend applies to both figures.

