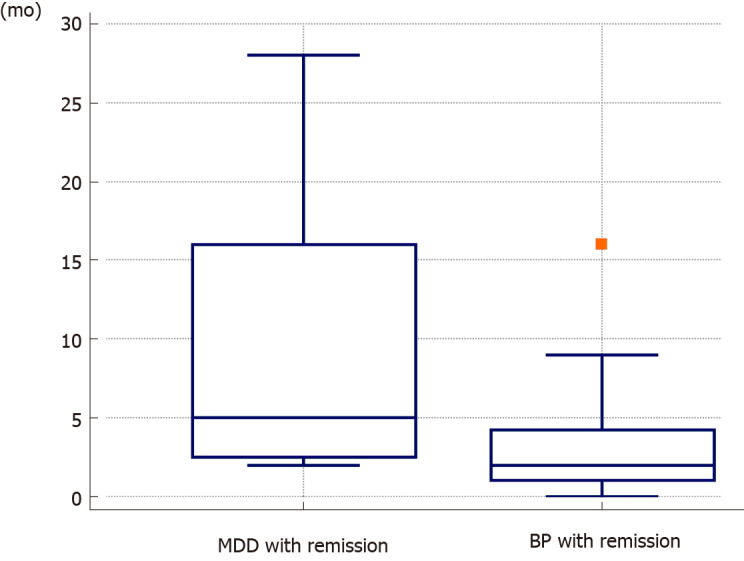
Figure 3.

Period to relapse in the continuation and/or maintenance electroconvulsive therapy group. The box-and-whisker plot displays the statistical summary of the variables. The central box shows values from the lower to the upper quartiles. The middle line represents median values. The horizontal line extends from the minimum to the maximum value, excluding the outliers, which are displayed as separate points. The BP participants in group D experienced relapse significantly earlier than the major depressive disorder participants in group C.
