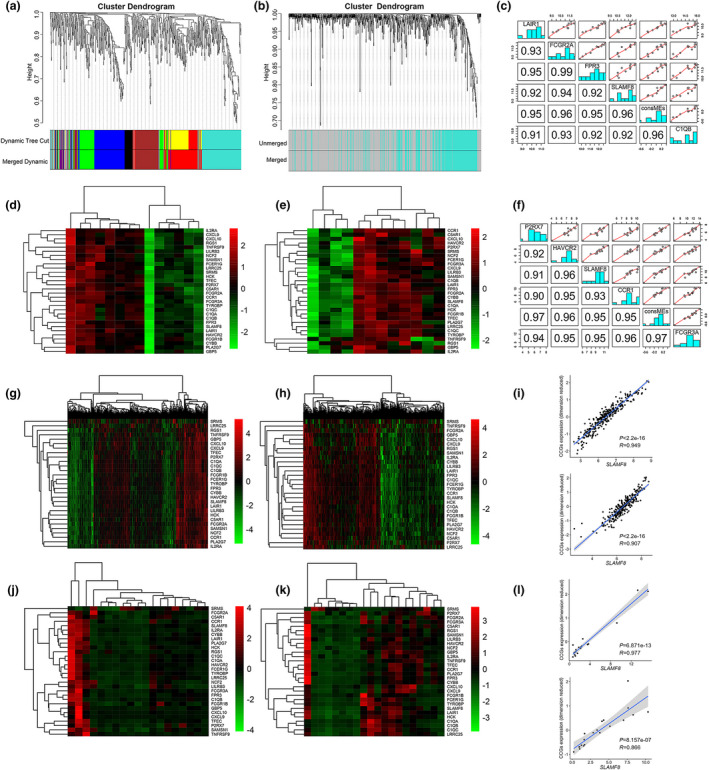
Figure 2.

Identification and validation of the consistent coexpression signature and the tag gene SLAMF8. Genes coexpressed in EBV+ GC (a) the squares with different colours on the bottom of the graph represent different coexpressed gene groups; identification of CCGs between EBV+ and EBV− GC tissues using the squares of coexpressed genes in EBV+ GC (b); good performance of the top 30 CCGs in clustering EBV+ (d) and EBV− GC (e); top 5 correlations of the CCGs with consistent consME in EBV+ (c) and EBV− GC (f) identified SLAMF8 as the tag gene of CCGs. Note: ConsME values were derived from primary component analysis. The top 30 CCGs in clustering GC (g) and CRC (h) tissues using GSE62254 and GSE14333 datasets, respectively, from the GEO database. The significant correlation of mRNA expression between SLAMF8 and the 30 top CCGs (dimension reduced) in GC (above) and CRC (below) tissues by analysis of GSE62254 and GSE14333 datasets, respectively (i). RNA‐sequencing analysis of GI cancer tissues from our centre also showed that the 30 top CCGs had good performance in clustering GC (n = 19, j) and CRC tissues (n = 20, k), and the significant correlation between mRNA expression of SLAMF8 and the 30 top CCGs (dimension reduced) in GC (above) and CRC (below) tissues (l).
