Figure 3.

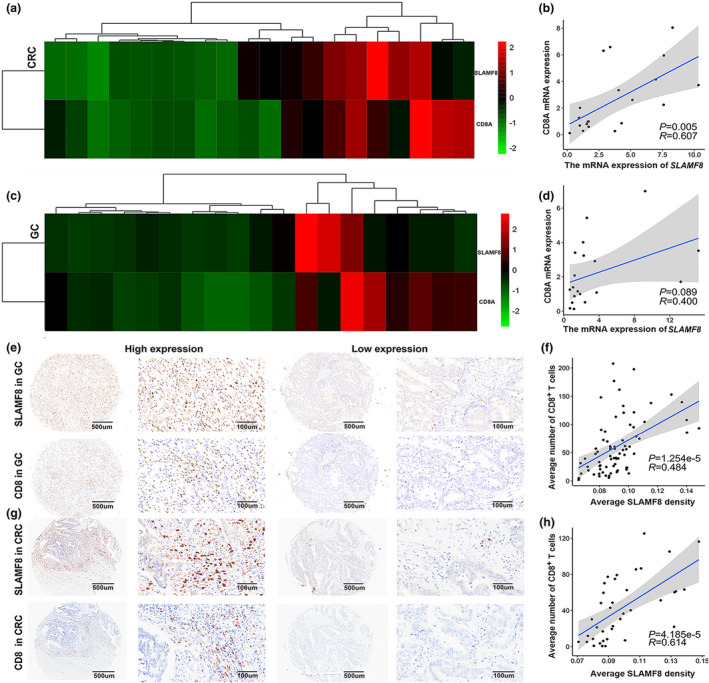
Higher expression of SLAMF8 was associated with increased infiltration of CD8+ T lymphocytes in GI cancer tissues. The heatmap shows the mRNA expression of SLAMF8 and CD8 in CRC (a) and GC (c) tissues and the significant correlation between the two genes using RNA‐sequencing data of CRC (n = 20, b) and GC (n = 19, d) tissues from our centre. Representative images of SLAMF8 and CD8 IHC staining in GC (n = 74, e) and CRC (n = 38, g) tissues using GC and CRC tissue microarrays, respectively, with scale bars of 500 μm (left) and 100 μm (right). Quantification of IHC analysis in GC (f) and CRC (h) tissues showed a significant correlation between SLAMF8 and CD8 expression.
