
Figure 4.
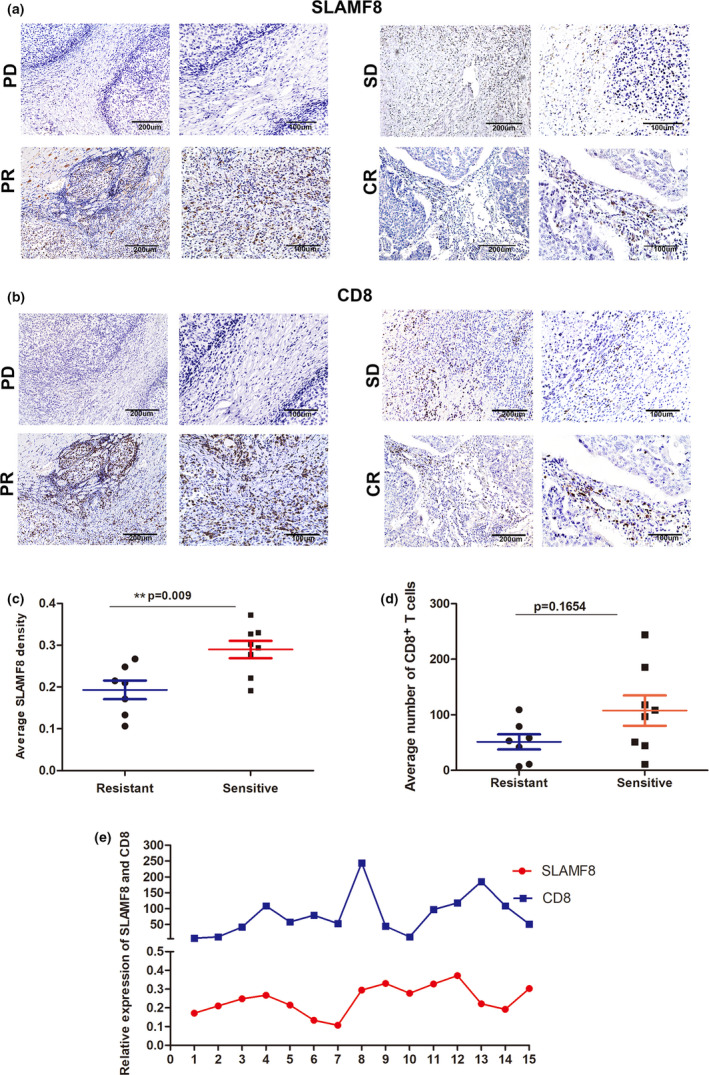
Predictive ability of SLAMF8 for anti‐PD1 treatment in clinical practice. Representative image of pretherapeutic SLAMF8 (a) and CD8 (b) protein expression stained by IHC in cancer tissues, with scale bars of 200 μm (left) and 100 μm (right), from patients who obtained the best response of CR, PR, SD and PD, respectively. Comparison of pretherapeutic SLAMF8 (c) and CD8 (d) protein expression between patients with tumors sensitive to (CR + PR) and those with tumors relatively resistant to (SD + PD) anti‐PD1 treatment (n = 8 (CR + PR) for the sensitive group and n = 7 (SD + PD) for the resistant group, **P < 0.01). The relationship between SLAMF8 and CD8 expression (e). Nonstatistical images are from one experiment that is representative of three separate experiments.