Figure 5.

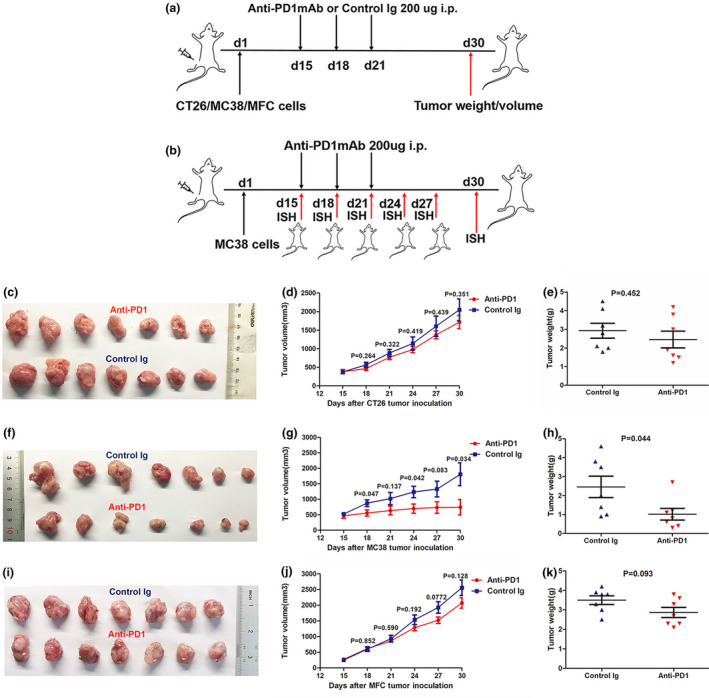
The establishment of tumor models resistant or sensitive to anti‐PD1 treatment. Schematic model of establishment and further treatment process for mice‐bearing murine CT26 (CRC), MC38 (CRC) and MFC (GC) tumors (n = 7 per group). Mice were treated with control murine Ig (2A3) or anti‐PD‐1 mAb on Days 15, 18 and 21 and then sacrificed on day 30 for analysis of tumor weight and volume (a). Process diagram of MC38 tumor models treated with anti‐PD1 mAb for dynamic ISH analysis for SLAMF8 expression. Tumor‐bearing mice were injected with anti‐PD1 mAb on Days 15, 18 and 21 and were sacrificed on Days 15, 18, 21, 24, 27 and 30. Then, the resected tumors were submitted for ISH staining (b). Representative images of CT26 (c), MC38 (f) and MFC (i) tumor models treated with anti‐PD1 mAb and control Ig (2A3). Tumor growth curves and tumor weight plots of CT26 (d, e), MC38 (g, h) and MFC (j, k) tumors. Nonstatistical images are from one experiment that is representative of three separate experiments.
