
Figure 7.
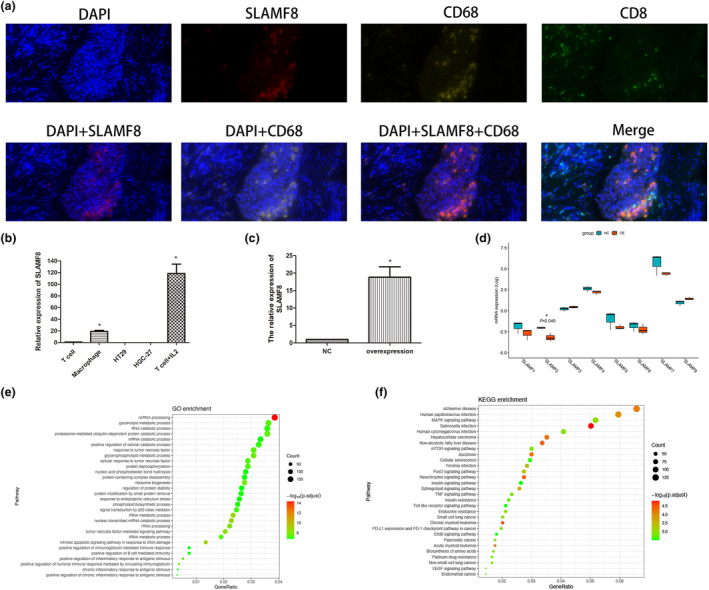
Location, expression and potential function of SLAMF8 in the antitumor immune response. Representations of multiplex immunofluorescence of SLAMF8 (red), CD68 (yellow), CD8 (green), and merged images in gastric cancer tissue (a); quantitative RT–PCR was used to analyse the expression levels of SLAMF8 in common T cells, T cells stimulated by IL‐2, HT29 cells, HGC27 cells and macrophages (b); the mRNA expression of SLAMF8 in TPH1‐induced macrophages with exogenous overexpression of SLAMF8 and the negative control (c); the impact of SLAMF8 overexpression in macrophages on other SLAMF family genes expression by RNA sequencing and related comparison (d); GO (e) and KEGG (f) pathway analysis to explore the pathways enriched by exogenous overexpression in macrophages. Nonstatistical images are from one experiment that is representative of three separate experiments.