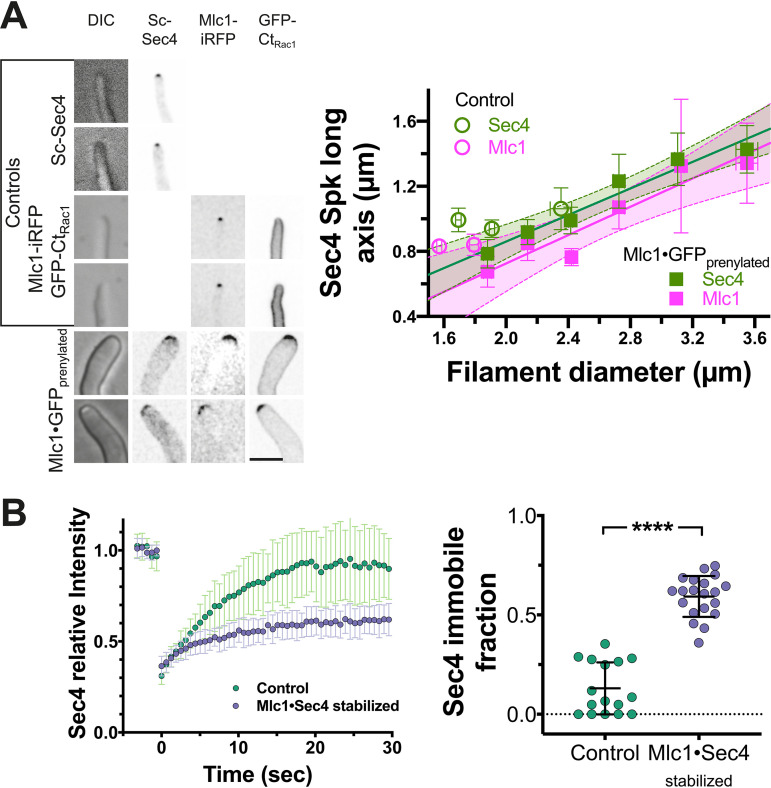
FIG 7.
Synthetic physical interaction of Mlc1 alters the distribution of secretory vesicles and immobile fraction. (A) Secretory vesicle clusters are more spread out in Mlc1·GFP prenylated strain. Images (sum projections) of control (mlc1Δ/MLC1; PY5018) and Mlc1·GFP prenylated (Mlc1-iRFP-GNB and GFP-CtRac1; PY5831) strains expressing Scarlet-Sec4, as well as the control strain expressing Mlc1-iRFP and GFP-CtRac1, PY4776, with examples of wider filaments shown (left). Sum projections of 41 × 0.2 μm z-sections (left). The graph shows the quantitation of Scarlet-Sec4 and Mlc1-iRFP long axis in respective strains (PY5018, PY4776, and PY5831) (right) with filament diameter. Filament diameter and Mlc1 or Sec4 long axis were determined from sum projections of 50 to 70 cells, and values were binned every 0.3-μm filament diameter (6 to 26 cells per bin) with mean values and standard error of the mean shown. The lines fit for Sec4 or Mlc1 have an r2 of 0.95 or 0.90; note that the y-intercepts are very close to 0 with 95% confidence level prediction shown in light green (Sec4) or magenta (Mlc1). Bar, 5 μm. (B) Stabilization of Mlc1-Sec4 interaction at the Spitzenkörper increases the Sec4 immobile fraction. Fluorescence recovery after photobleaching of GFP-Sec4 in the indicated strains (Control; wild-type expressing GFP [PY4809] and Mlc1·Sec4 stabilized expressing Mlc1-iRFP-GNB and GFP-Sec4 [PY5405]). (Left) The mean FRAP recovery curve (n = 16 to 20 cells) with standard deviation shown (left panel). An increase in the immobile fraction is observed in the stabilized strain (right panel). Immobile fraction values with standard deviations are shown; **** indicates a P value of <0.0001.

