
FIG 5.
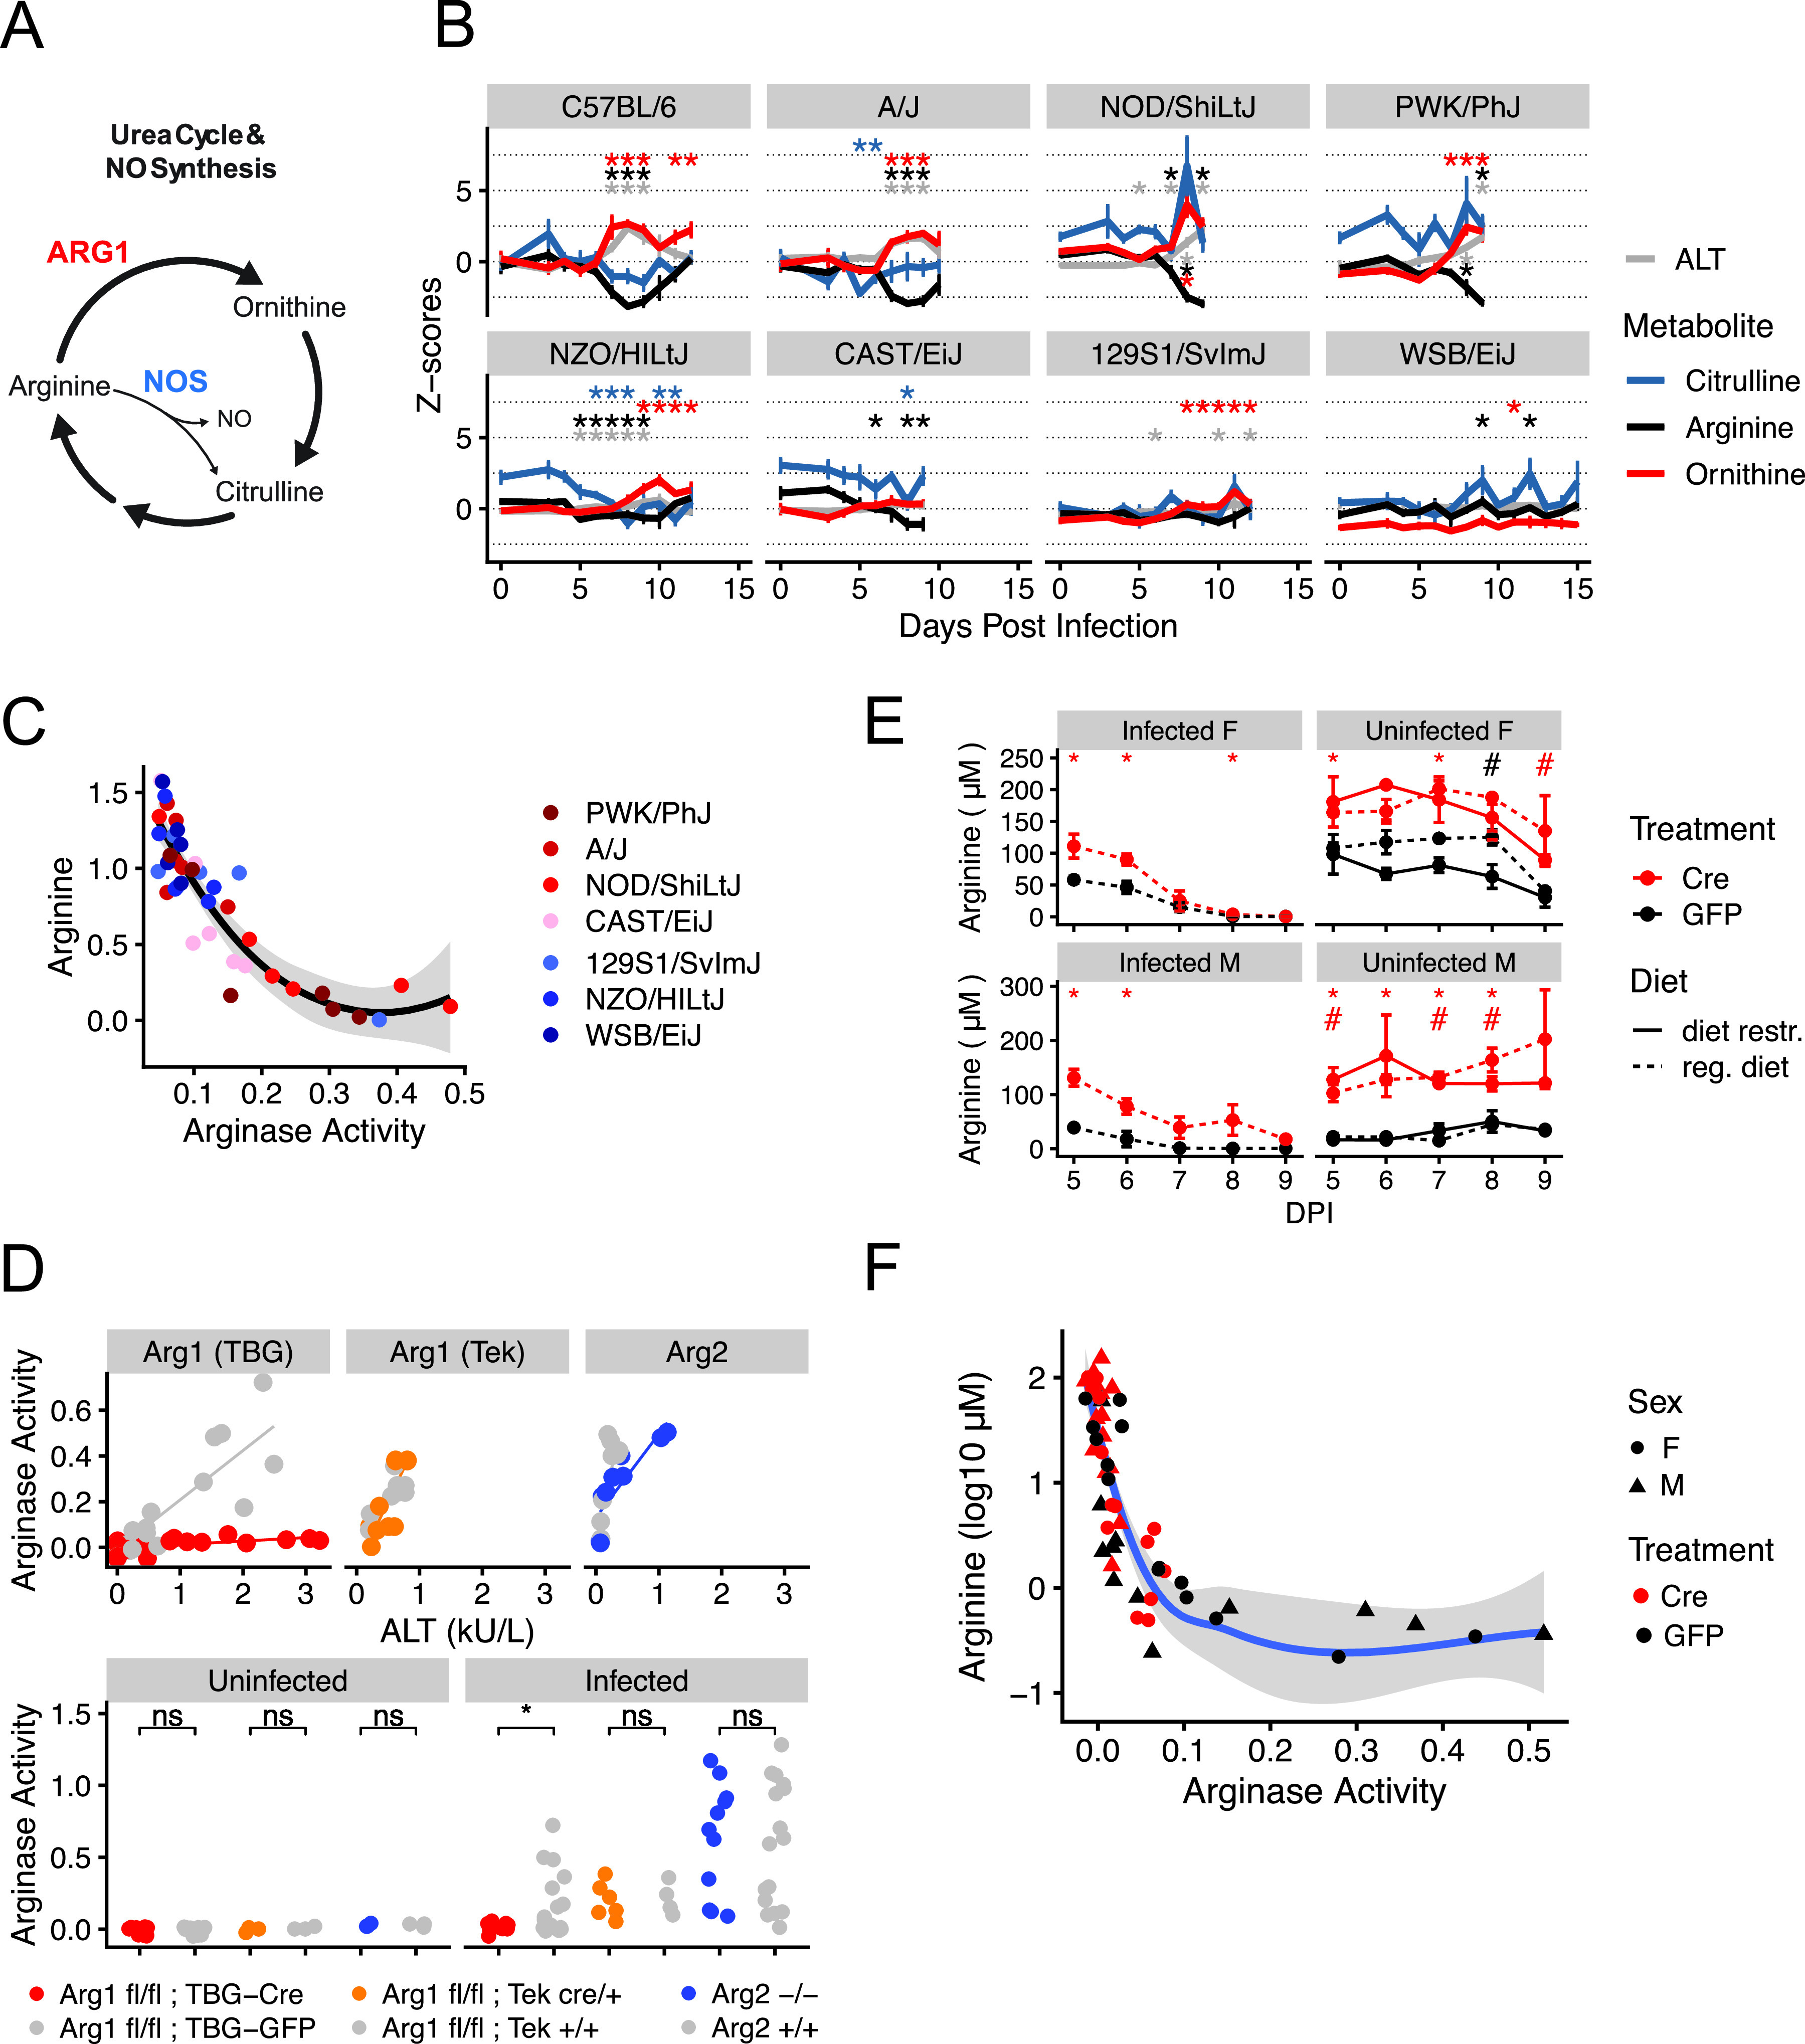
The liver controls arginine metabolism via arginase-1. (A) A schematic of the urea cycle, polyamine metabolism, and nitric oxide production. NO, nitric oxide; NOS, nitric oxide synthase; ARG1, arginase-1. (B) Median scaled imputed ion counts of arginine, ornithine, and citrulline throughout infection. Z-score = 1 standard deviation from the mean of uninfected C57BL/6 mice. n = 5 animals per strain per day. (C) Plasma arginase activity (nanomoles of H2O2/minute/microliter of blood) and scaled imputed ion counts of arginine (log10-transformed Z-scores) in seven of eight P. chabaudi-infected founder strains (n = 6 per strain). A Loess curve with standard errors (gray shaded area) is shown. (D) Plasma arginase activity (nanomoles of H2O2/minute/microliter of blood) and ALT in arginase knockout C57BL/6 mice before and during P. chabaudi infection (n ≥ 3 uninfected mice per genotype, n ≥ 6 infected mice per genotype in two experimental replicates). Statistical significance by Welch’s t test is indicated as follows: *, P < 0.05; ns, not significant. (E) Mean (± standard error [SE]) plasma arginine in uninfected (with or without dietary restriction) and P. chabaudi-infected Arg1fl/fl; TBG-Cre and Arg1fl/fl; TBG-GFP mice (n = 3 per condition per sex, day 5 postinfection is day 12 post-AAV injection). F, female; M, male; diet restr., dietary restriction; reg. diet, regular diet. (F) Plasma arginase activity (nanomoles of H2O2/minute/microliter of blood) and arginine for infected mice and days shown in panel E. A Loess curve with standard errors (gray shaded area) is shown.