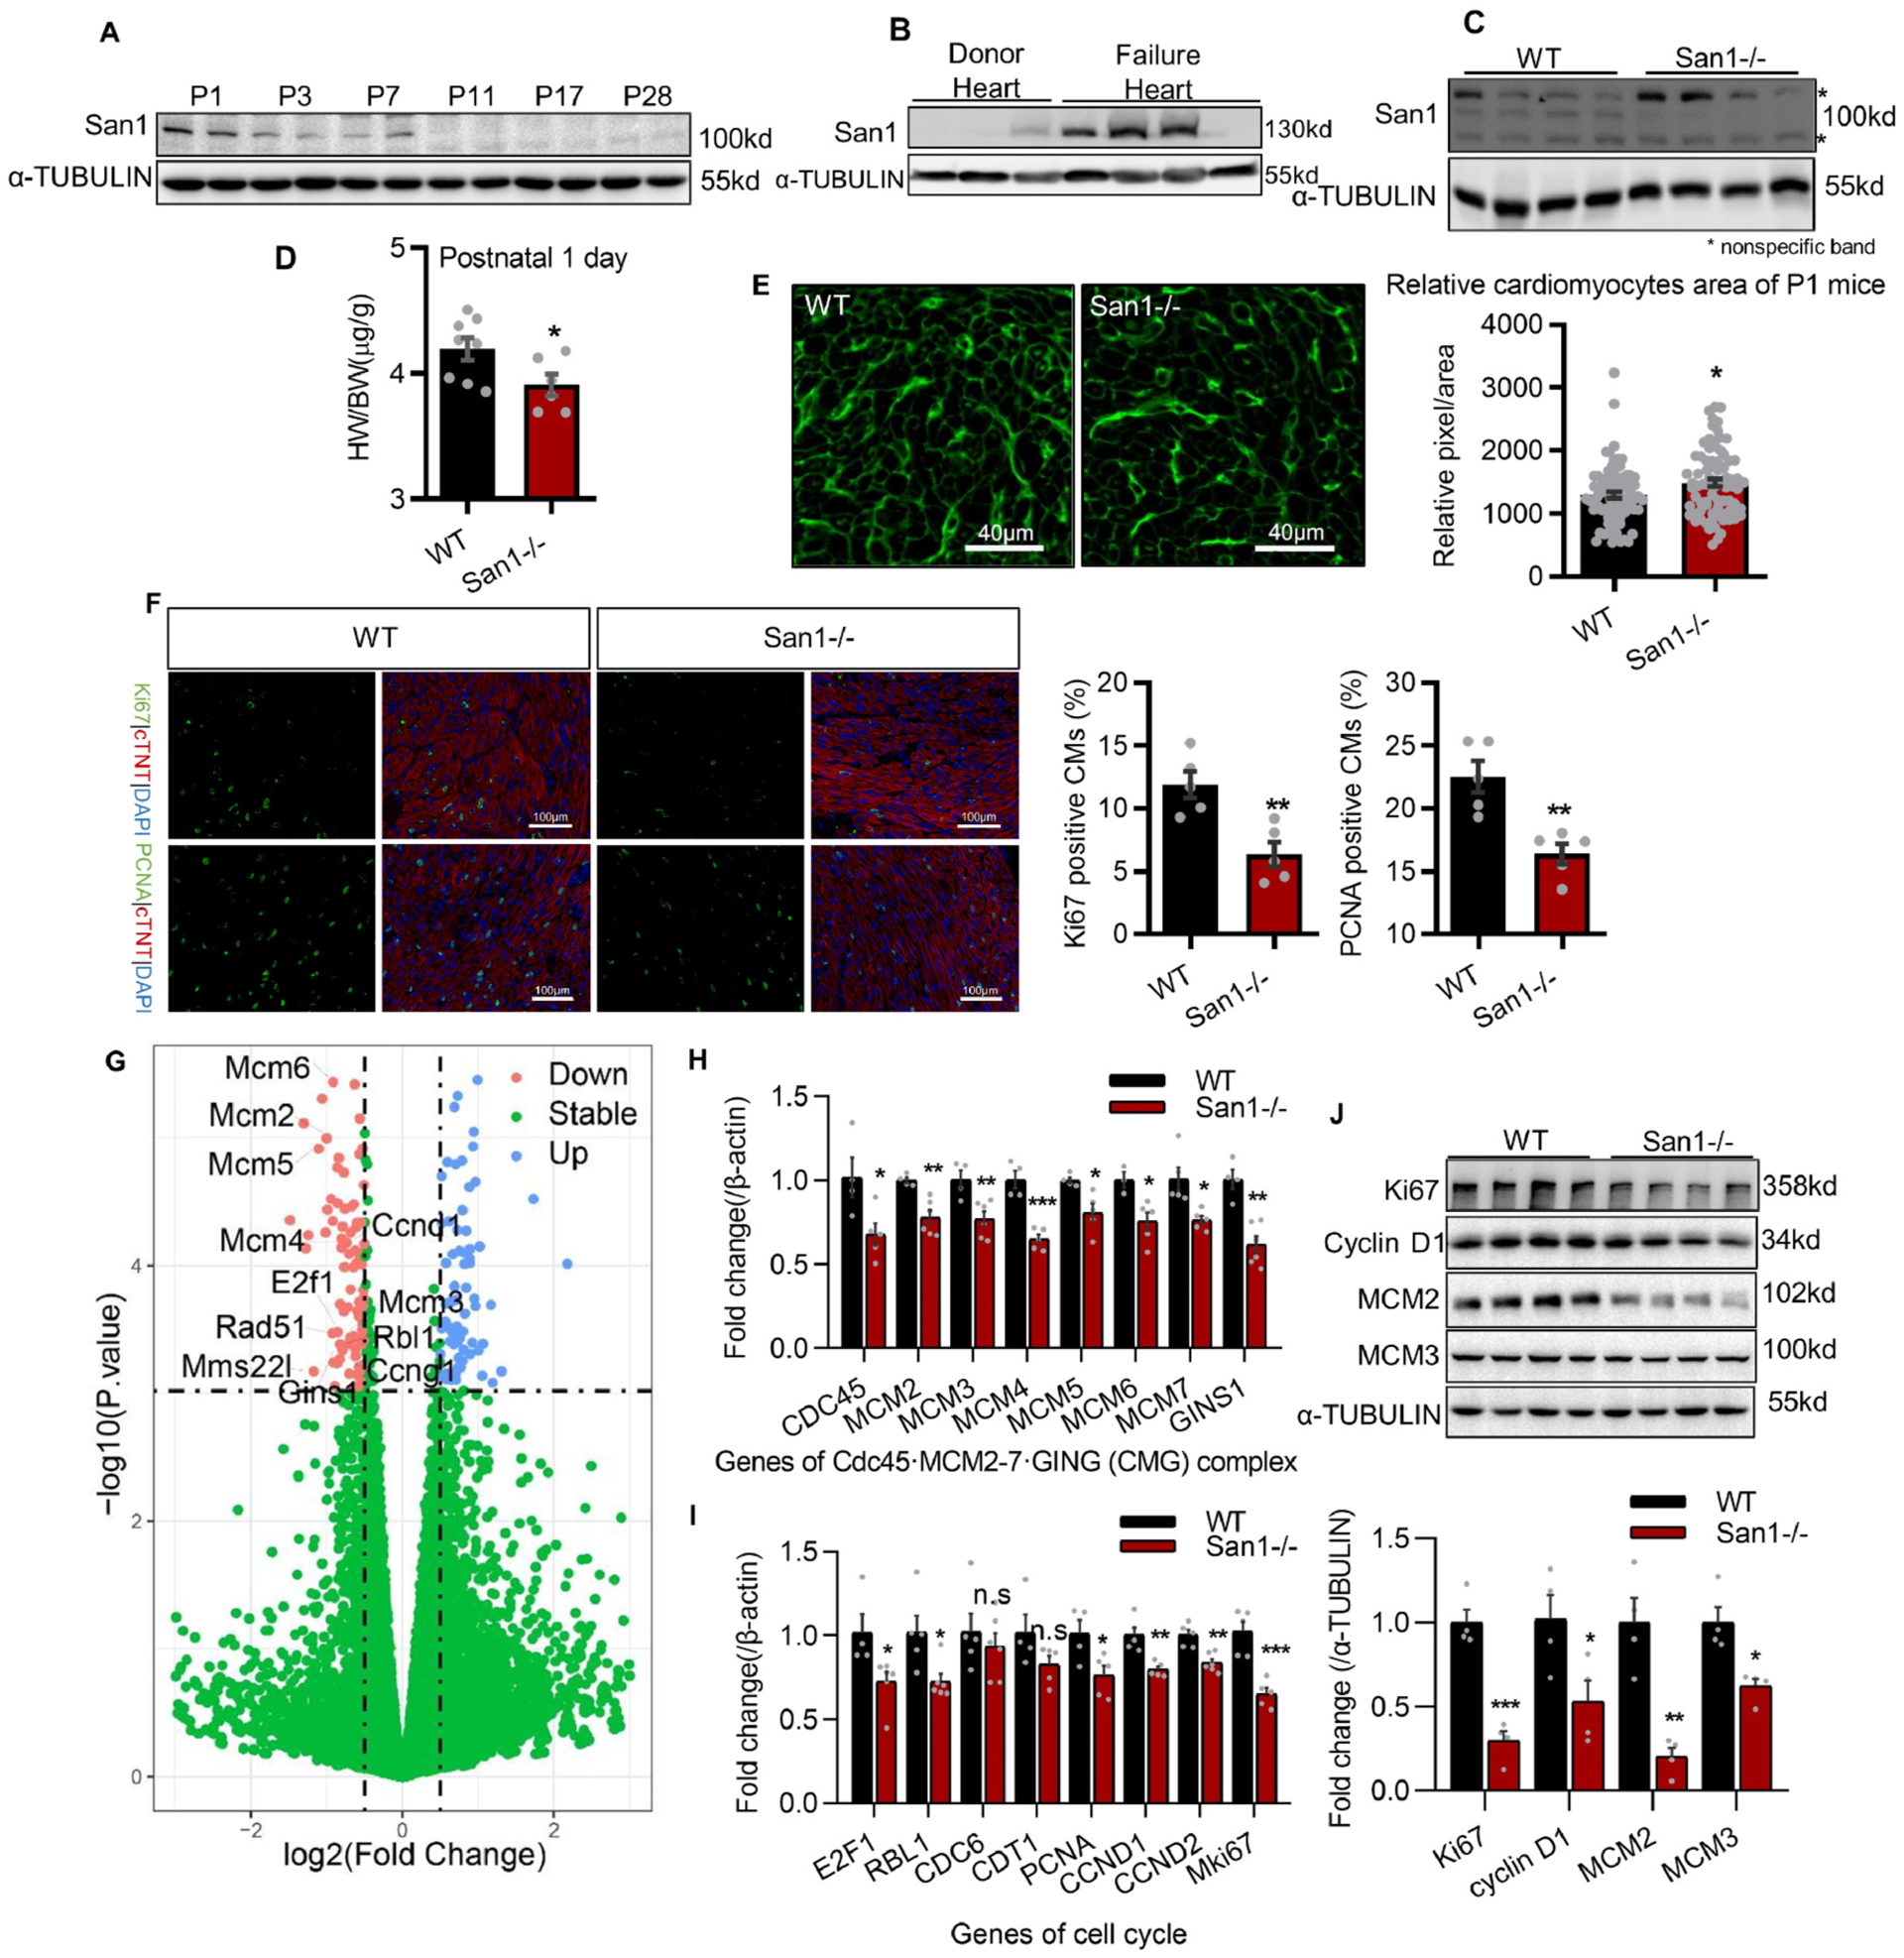
Fig. 1.

San1 deficient hearts revealed impaired CM proliferation in newborns. (A) San1 expression was monitored by immunoblotting in ventricular homogenates from mice of different ages. Relative protein levels were analyzed by densitometric methods and quantified by GraphPad Prism 8. P1–28 means postnatal 1–28 days. (B) San1 expression was detected by immunoblotting in hearts from the patients with end-stage heart failure and the normal adults. (C) Immunoblotting confirmed that San1 was completely broken in hearts of San1−/− mice. (D) In San1−/− and wild type (WT) mice of P1, the heart weight/body weight (HW/BW) ratio were determined (n = 8 in WT group, n = 6 in San1−/− groups). (E) Wheat germ agglutinin (WGA) staining of left ventricular sections was analyzed to indirectly determine the cross-sectional area (dot plot shows relative area per CMs from 6 different mice, scale bars, 40 μm). (F) Representative proliferative activity (labeled by Ki67 and PCNA) staining. Right panel: Quantification of cardiomyocytes proliferation activity from 5 different mice (scale bars, 100 μm). (G) volcano plot of RNA-sequencing data from hearts of WT and San1-deficiency mice at P1. (H and I) qRT-PCR analysis of DNA replication initiation and cell cycle genes in San1−/− and WT cardiomyocytes at P1 (n = 4–6). (J) Representative cell proliferation indicators (KI67, Cyclin D1) and DNA replication initiation helicases (MCM2, MCM3) were monitored in San1−/− and WT hearts of P1 mice by immunoblotting. Values are presented as mean ± SEM. n.s means not significant P > 0.05; *P < 0.05 vs. WT; **P < 0.01 vs. WT; ***P < 0.001 vs. WT. P values determined by unpaired Student’s t-test (2-tailed).
