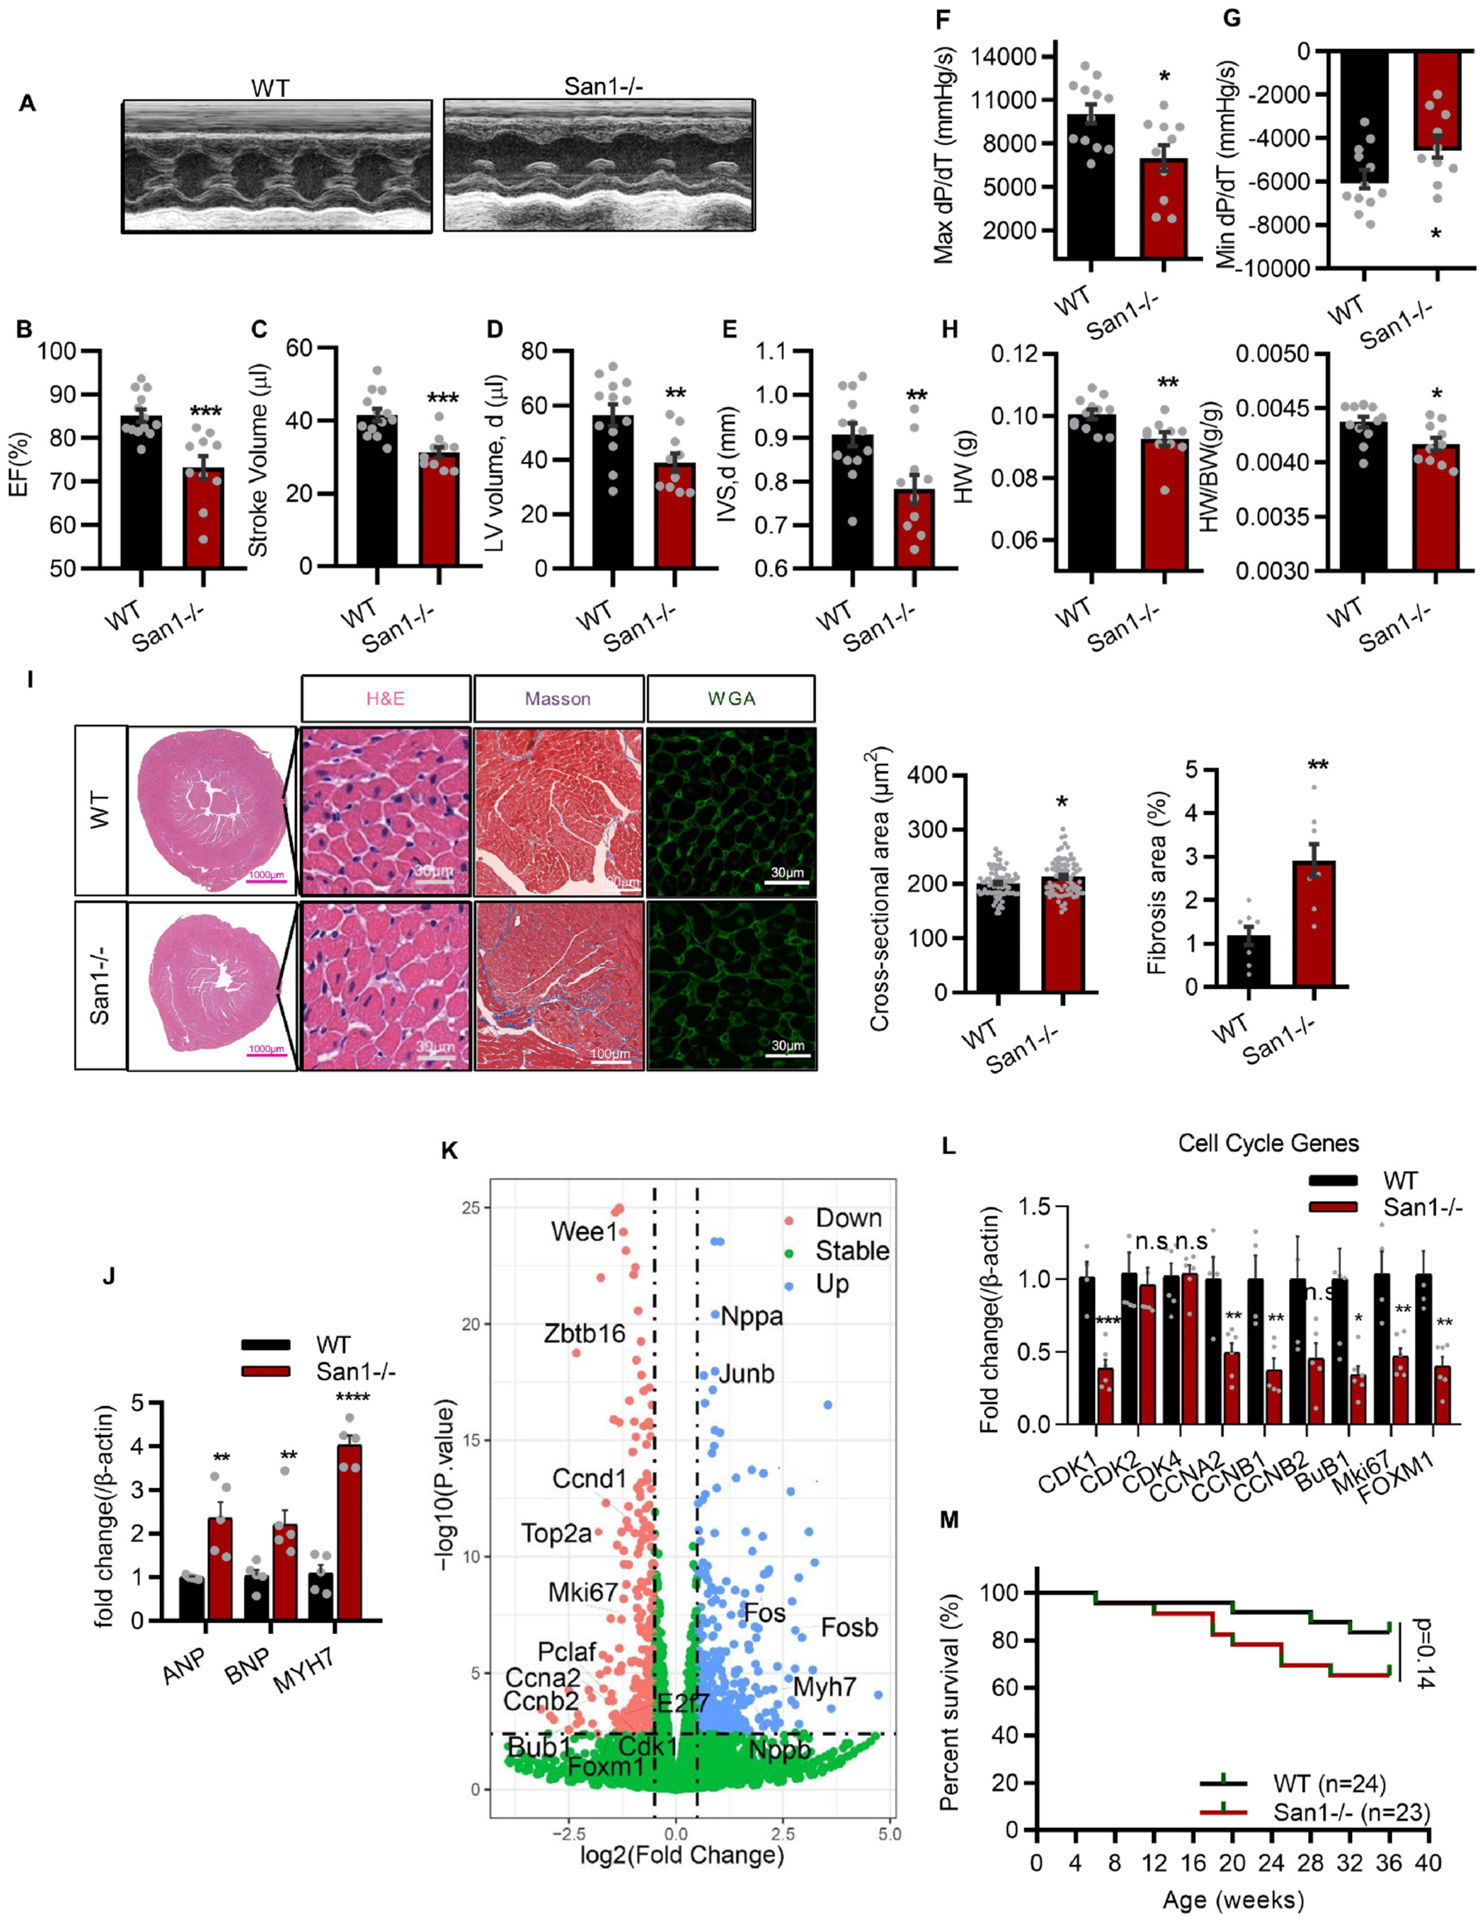
Fig. 2.

CM hypoplasia, CM hypertrophy, cardiac dysfunction, and fibrosis in 12-week-old San1−/− mice. (A-E) San1−/− and WT mice at 12 weeks were subjected to transthoracic echocardiographic examination (A), left ventricular ejection fraction (EF, %) (B), stroke volume (μl) (C), diastolic volume (μl) (D) and interventricular septal thickness at diastole (IVSd, mm) (E) were recorded (n = 10–13). (F and G) Maximal slope of systolic pressure increment (Max dP/dT, mmHg/s), and minimal slope of diastolic pressure decrement (Min dP/dT, mmHg/s) of San1−/− and WT mice were evaluated through cardiac catheterization method (n = 10–12). (H) The heart weight and the HW/BW ratio (n = 10–12). (I) Representative images of surface area of cardiomyocytes in San1−/− and WT mice were evaluated by wheat germ agglutinin (WGA) staining (scale bars, 30 μm) and hematoxylin/eosin (HE) staining (scale bars, 30 μm). Fibrosis level was staining by Masson trichrome (scale bars, 100 μm). Right panel: Quantification of cross-sectional area per CMs and relative fibrosis area from 6 different mice in the left panel. (J) Real-time quantitative PCR analysis of cardiac hypertrophic genes in San1−/− and WT hearts (n = 5). (K) volcano plot of RNA-sequencing data in San1−/− and WT hearts of mice at 12 weeks. (L) Real-time quantitative PCR analysis of cardiac proliferation gene in San1−/− and WT hearts (n = 6). (M) Survival curve of WT and San1−/− mice. p = 0.14, determined by log-rank (Mantel–Cox) testing (n = 24 in WT group, n = 23 in San1−/− groups). n.s means not significant P > 0.05; *P < 0.05 vs. WT; **P < 0.01 vs. WT; ***P < 0.001 vs. WT; ****P < 0.0001 vs. WT. P values determined by unpaired Student’s t-test (2-tailed).
