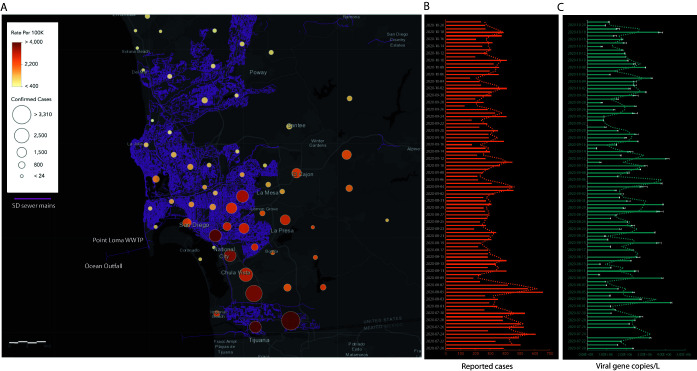
FIG 1.
Tracking infection dynamics in San Diego County. (A) Map showing the San Diego sewer mains (depicted in purple) that feed into the influent stream at the primary wastewater treatment plant (WWTP) at Point Loma. Overlaid are the cumulative cases recorded from the different zip codes in the county during the course of the study. The caseload was counted by cases per zip code from areas draining into the WWTP. The sizes of the circles are proportional to the diagnostic cases reported from each zone, and the color gradient shows the number of cases per 100,000 residents. (B) Daily new cases reported by the county of San Diego. (C) SARS-CoV-2 viral gene copies detected per liter of raw sewage determined from N1 Cq values corrected for PMMoV (pepper mild mottle virus) concentration. All viral concentration estimates were derived from the processing of two sample replicates and two PCR replicates for each sample (error bars show the standard deviations [SD]).

