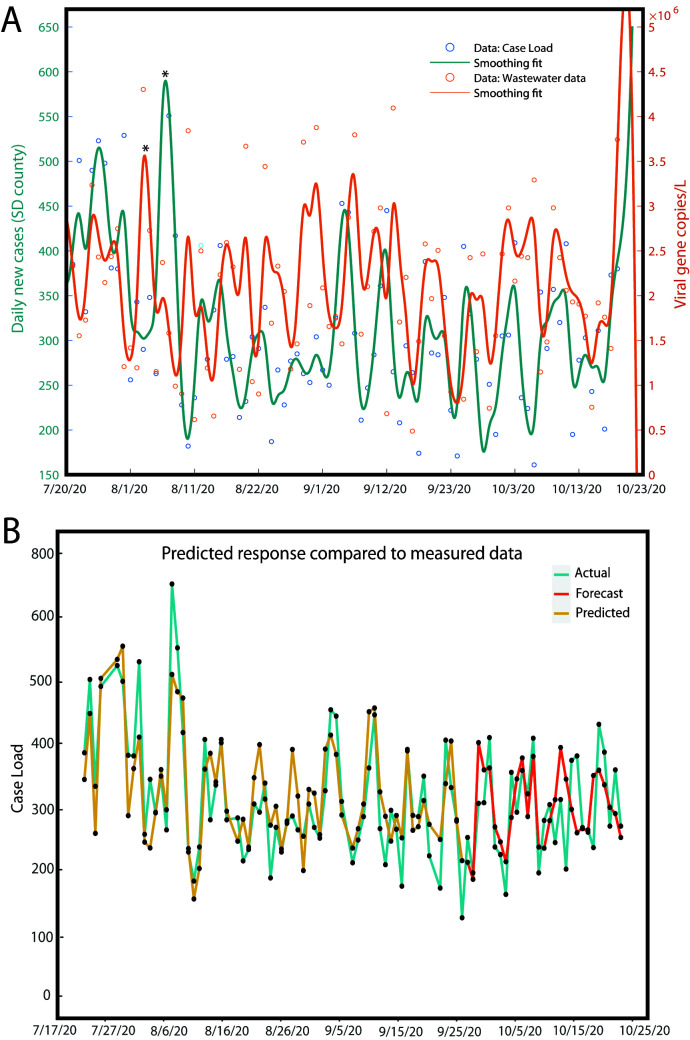
FIG 2.
(A) Daily caseload and wastewater viral concentration data shown for a period of 13 weeks, where a spline smoothing is applied to each time series to demonstrate general trends. (B) Predictive model showing the predicted data (yellow) compared to the observed caseload (blue) and the 4-week forecast (red). Data collected from 07/07/2020 to 09/28/2020 were used as the training data set to predict the caseload for the following weeks (up to 10/25/2020). Data (wastewater plus county testing data) gathered from 09/29/2020 to 10/21/2020 were used for model validation. MATLAB Systems Identification toolbox was used to estimate the model order and parameters and calculate the forecasted values.

