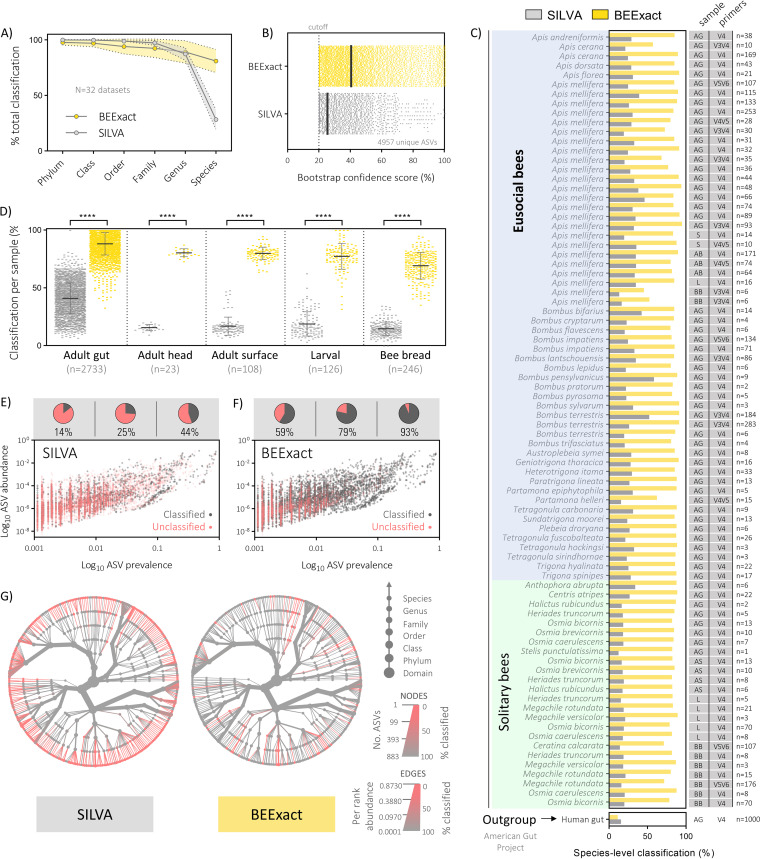
FIG 5.
BEExact classifies more ASVs and at higher confidence compared to the widely implemented SILVA database. (A) Overall classification rates at each taxonomic level for all data sets evaluated. Data depict means ± standard deviations at each level for n = 32 data sets with statistics shown for two-way ANOVA with Tukey’s multiple comparisons. (B) IDTAXA bootstrap confidence scores on the total set of 4,957 unique ASVs from all data sets combined. The dotted line showing the cutoff (20%) used for all other comparisons shown. (C and D) Classification rates broken down by bee species (grouped by eusocial or solitary type membership) (C) and by sample type irrespective of background bee type (D). Data depict means ± standard deviations per sample classified in each of the categories shown (two-way ANOVA with Tukey’s multiple comparisons). (E and F) Scatterplots demonstrate that BEExact outcompetes SILVA more often in assigning taxonomy to ASVs found at either high prevalence or abundance across all data sets evaluated. Nested visualization plots above show how classification rates change based on differences in ASV prevalence. (G) Heat trees display the weighted classification rates across the entire taxonomic lineage for the top ASVs after collapsing to species-level identity. A cutoff of 1% prevalence or 0.01% abundance was applied to show only the most relevant bee-related taxa while minimizing transient environmental taxa. Abundance was adjusted by normalizing for 16S rRNA copy number differences between taxon groups. AG, adult gut; AH, adult head; S, surface; L, larvae; BB, bee bread.

