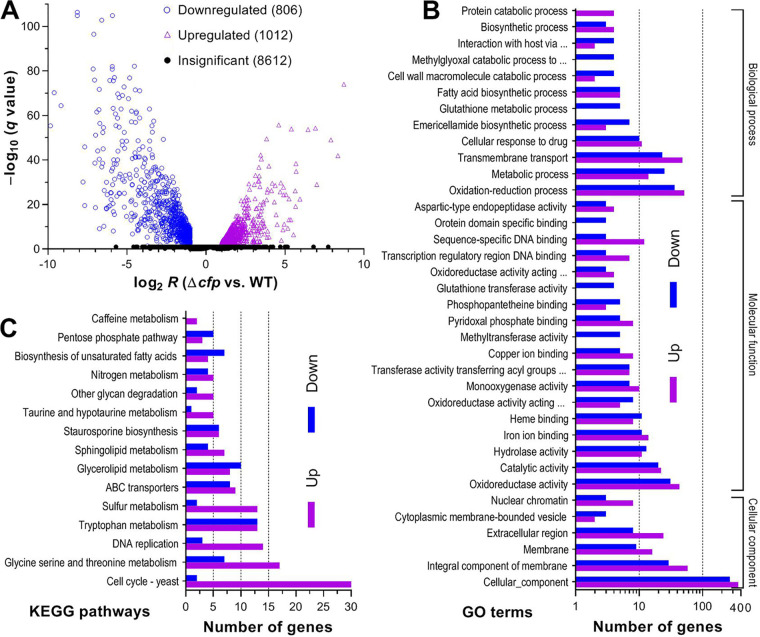
FIG 5.
Profound effect of cfp disruption on genomic expression of B. bassiana. (A) Distributions of log2 R and q values for all genes identified in the transcriptomes, which were generated from three 3-day-old SDAY cultures (replicates) of Δcfp and WT strains grown at the optimal regime of 25°C and L:D 12 h:12 h. Differentially expressed genes (DEGs) are those significantly downregulated (log2 R ≤ −1) or upregulated (log2 R ≥ 1) at the level of q value of <0.05. The rest of the genes are insignificantly affected (−1 ≤ log2 R ≤ 1 or q ≥ 0.05 when log2 R ≤ −1 or ≥ 1). (B and C) Counts of DEGs significantly enriched (P < 0.05) for three function classes (main GO terms shown) and KEGG pathways.

