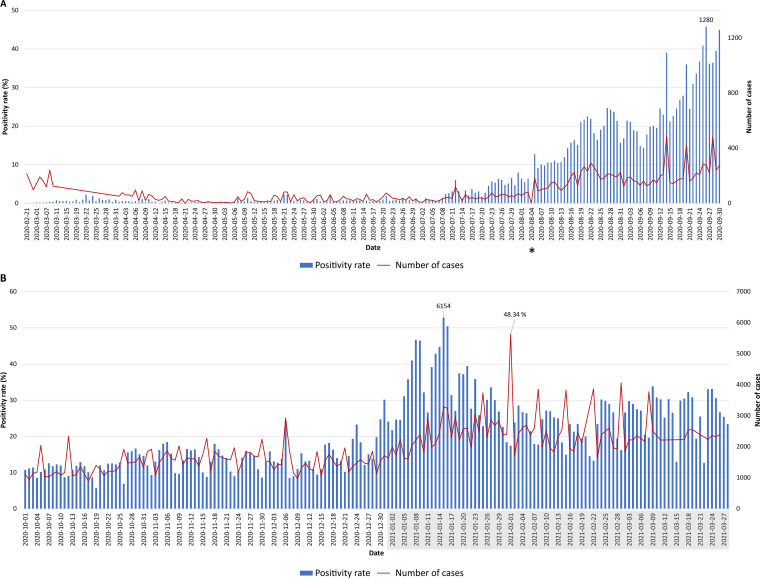
FIG 2.
The number of new daily COVID-19 cases and the daily positivity rate over a 1-year period. (A) Data shown covered the period between 21 February 2020 to 30 September 2020; (B) data shown covered the period between 10 January 2020 to 27 March 2021 (11) (https://www.emro.who.int/countries/lbn/index.html and https://twitter.com/WHOLebanon). Only dates with reported COVID-19 cases were included. The Beirut Port explosion on 4 August 2020 is indicated by an asterisk. 2021 dates are shown shaded in gray.

