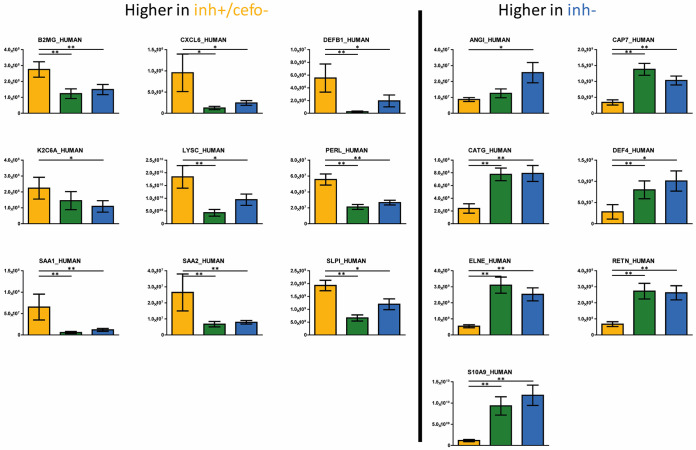
FIG 5.
Differential abundance of antimicrobial sputum proteins and derivative peptides. The bar plot graphs show the intensities (expressed as means ± standard error of the means [SEM] [error bars]) of proteins or derivative peptides that are known to inhibit bacterial growth and viability. The yellow (inh+/cefo−), green (inh+/cefo+), and blue (inh−) bars refer to the sample groups identified with PLS, as shown in Fig. 1A. Only those proteins that showed statistically significant differential abundance in the inh+/cefo− and inh− sputum sample groups are included (t test, P value ≤ 0.05, effect size [ES] ≥ 1.5; Table S3). Asterisks mark P values of ≤0.05 (*) and ≤0.01 (**).

