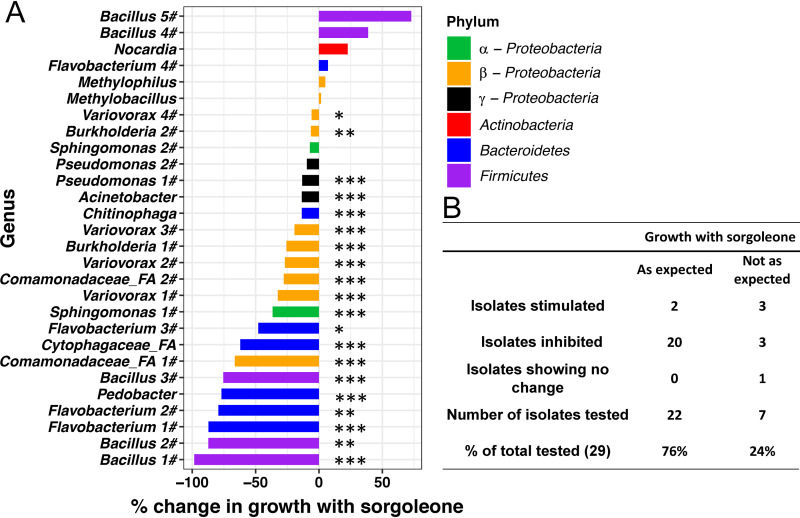
FIG 3.
Growth of bacterial isolates with sorgoleone. (A) Isolates were selected from a culture collection based on genus- or family-level similarity using differential abundance data from wild type and sorghum with RNAi event endosphere and rhizosphere data from field studies (summarized in Table S2 in the supplemental material). Percentage inhibition by 0.025 mM sorgoleone was calculated by [(ODwithout sorgoleone/ODwith sorgoleone) × 100] − 100. Welch’s t test was used due to unequal variance between sorgoleone-treated samples and control samples. P values from one-sided tests were converted to q values to control for false-discovery rates. ***, P < 0.001; **, P, < 0.01; *, P < 0.05. (B) Table indicates how the in vitro results matched with culture-independent data for the 29 isolates (Table S2). α-Proteobacteria, Alphaproteobacteria; β-Proteobacteria, Betaproteobacteria; γ-Proteobacteria, Gammaproteobacteria.

