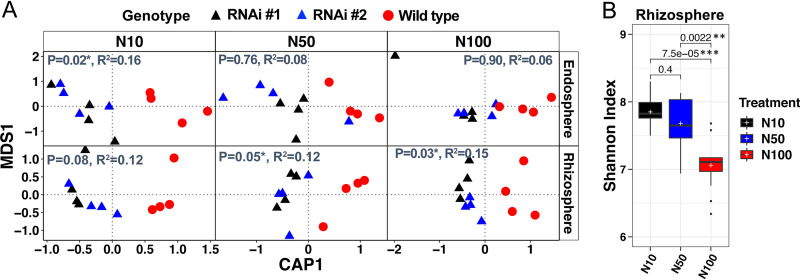
FIG 5.
β-Diversity analysis for rhizosphere, endosphere, and soil samples from a greenhouse experiment conducted with different nitrogen levels (N10, 1.15 mM N; N50, 5.75 mM N; N100, 11.5 mM N). (A) Canonical analysis of principal coordinates (CAP) was performed on Bray-Curtis distance matrix in which treatment was constrained and genotype was factored out. The P values and R2 on the top left of each graph show the PERMANOVA results. (B) Shannon index for rhizosphere under nitrogen treatment conditions in the greenhouse. The P values shown on the top were calculated by the Wilcoxon nonparametric statistical test. Line and the plus marker in the boxes represent median and mean, respectively, top and bottom of boxes represent first and third quartiles, respectively, and whiskers indicate 1.5 interquartile range.

