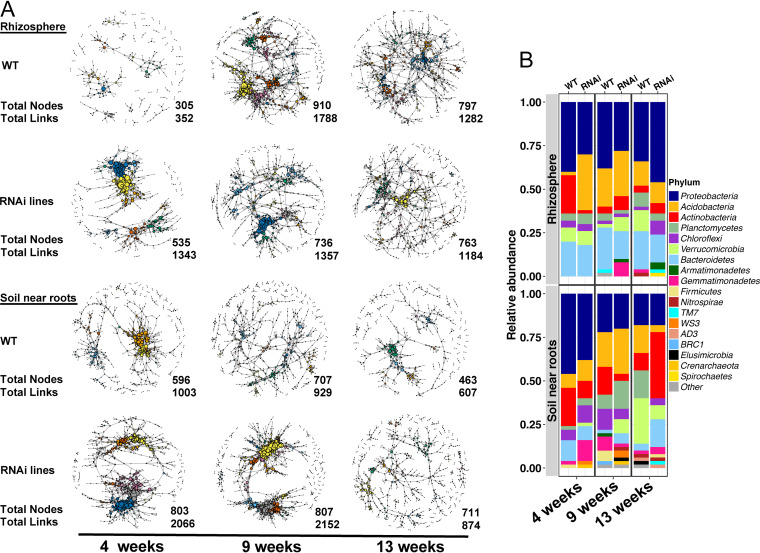
FIG 6.
Co-occurrence OTU network analysis and relative abundance of the 50 OTUs with the highest hub scores. (A) Bacterial and archaeal co-occurrence networks over time as affected by sorghum genotype (wild type or RNAi events) and sample type in 2016 field. Node represents individual OTU; edges represent significant positive Spearman correlations (ρ > 0.8 and P value ≤0.01). Number of the total nodes and links shown at the bottom right of each network. (B) The relative abundance of the 50 OTUs with the highest hub score in each network is displayed. The x axis indicates the time and genotype, with the relative abundance shown on the y axis. Top graph indicates the rhizosphere and bottom indicates the soil near roots. Color of bar indicates the different phyla.

