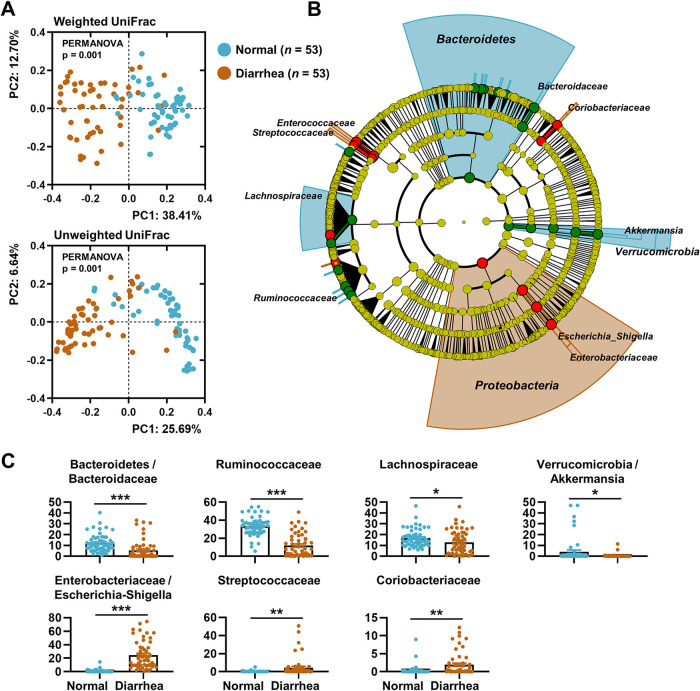
FIG 2.
Rectal bacterial profiles of normal and diarrheic calves. (A) PCoA of the rectal bacterial 16S rRNA sequences based on the weighted and unweighted UniFrac distance matrices. Data from the normal and diarrheic groups (n = 53 for each) are shown. (B) The abundance patterns of bacterial taxa in each group analyzed using the LEfSe circular cladogram. The discriminant taxa for each group are denoted in different colors. (C) Relative abundance of the discriminant taxa in ASV feature tables for each group presented as bar graphs. The data were analyzed using the multiple t test. Correction for multiple comparisons was made using the false-discovery rate (FDR; threshold of 0.05). *, adjusted P < 0.05; **, P < 0.01; ***, P < 0.001. Data are shown as mean ± SEM.

