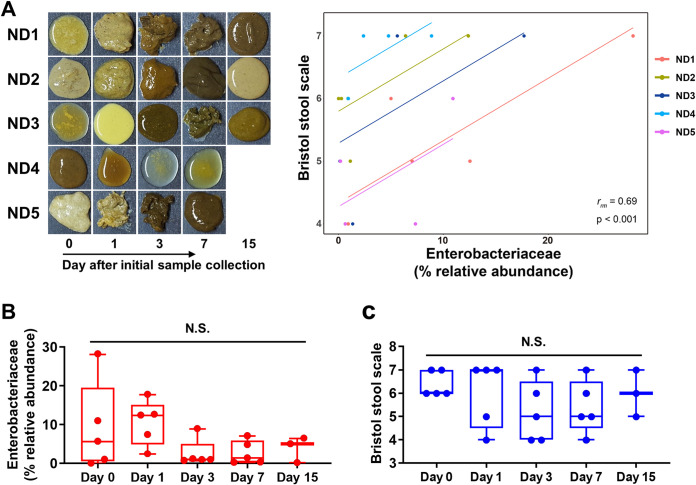
FIG 3.
The correlation coefficient analysis of the gut Enterobacteriaceae and the incidence of diarrhea in intermittently diarrheic calves. Rectal luminal contents were collected from calves with repeated normal diarrhea (ND, 23 samples from 5 calves). (A) Images of the rectal luminal content of the ND samples (left). The repeated measures correlation was calculated based on the relative abundance of the family Enterobacteriaceae (x axis) and the Bristol score (y axis) of the collected samples (right). (B and C) The relative abundance of the family Enterobacteriaceae (B) and the Bristol score of the samples (C) were categorized by the sample collection time. The data were analyzed by ANOVA followed by Tukey’s post hoc test (N.S., not significant). Data are shown as mean ± SEM.

