FIG 4.
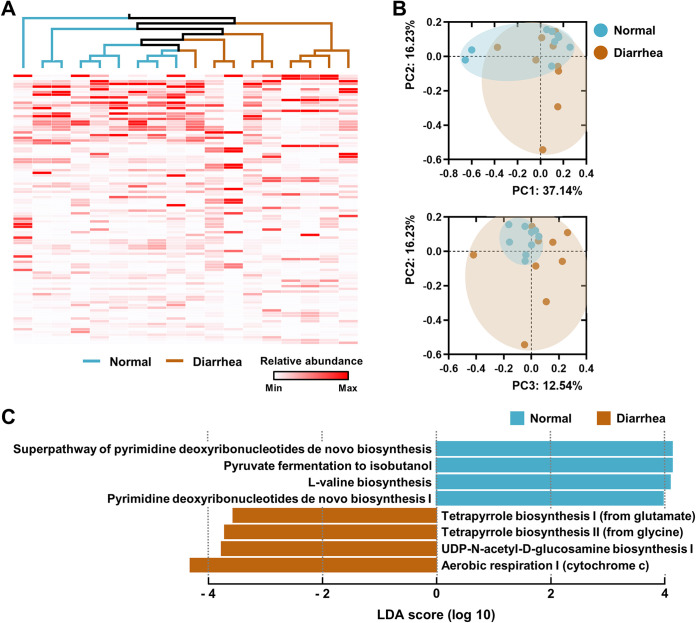
Metatranscriptomic profiles of the rectal microbiome of normal and diarrheic calves. Normal (n = 9) and diarrheic (n = 9) rectal metatranscripts generated by RNA-Seq were functionally profiled using the HUMAnN2 pipeline. (A) The genes abundantly expressed in samples (the top 100 among the 121,568 assigned genes) were clustered using the UPGMA dendrogram based on the abundance-weighted Jaccard distance (abund_jaccard). The relative abundance of the expressed genes is presented as a heatmap. (B and C) At the pathway level, pathway abundances in the samples were clustered using the abund_jaccard-based PCoA (B), and the discriminant pathways for each group were determined using the LEfSe (C).

