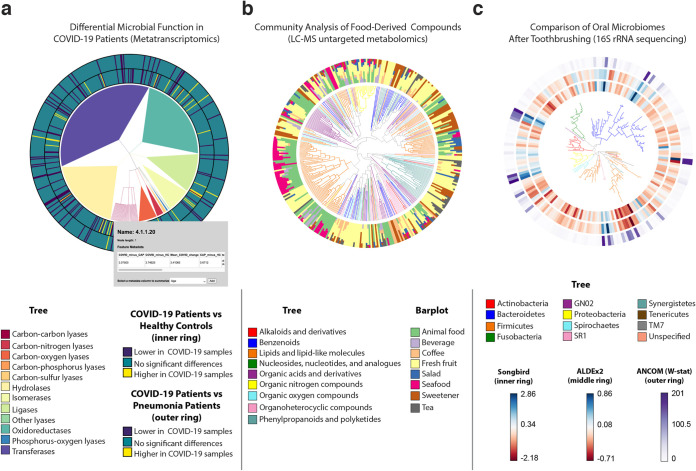
FIG 2.
EMPress is a versatile exploratory analysis tool adaptable to various ‘omics data types. (a) RoDEO differential abundance of microbial functions from metatranscriptomic sequencing of COVID-19 patients (n = 8) versus community-acquired pneumonia patients (n = 25) and versus healthy control subjects (n = 20). The tree represents the four-level hierarchy of the KEGG enzyme codes. The barplot depicts significantly differentially abundant features (P < 0.05) in COVID-19 patients. Clicking on a tip produces a pop-up insert tabulating the name of the feature, its hierarchical ranks, and any feature annotations. (b) Global FoodOmics Project LC-MS data. Stacked barplots indicate the proportions of samples (n = 70) (stratified by food) containing the tips in an LC-MS Qemistree of food-associated compounds, with tip nodes colored by their chemical superclass. (c) De novo tree constructed from 16S rRNA sequencing data from 32 oral microbiome samples. Samples were taken before (n = 16) and after (n = 16) subjects (n = 10) brushed their teeth; each barplot layer represents a different differential abundance method’s measure of change between before- and after-brushing samples. The innermost layer shows estimated log-fold changes produced by Songbird, the middle layer shows effect sizes produced by ALDEx2, and the outermost layer shows the W-statistic values produced by ANCOM (see Materials and Methods). The tree is colored by tip nodes’ phylum-level taxonomic classifications. Interactive figures can be accessed at https://github.com/knightlab-analyses/empress-analyses.

